- ETC/BTC has been trading higher on Tuesday and has broken out of a long term trendline.
- The pair is showing some small signs of recovery after a long term downtrend.
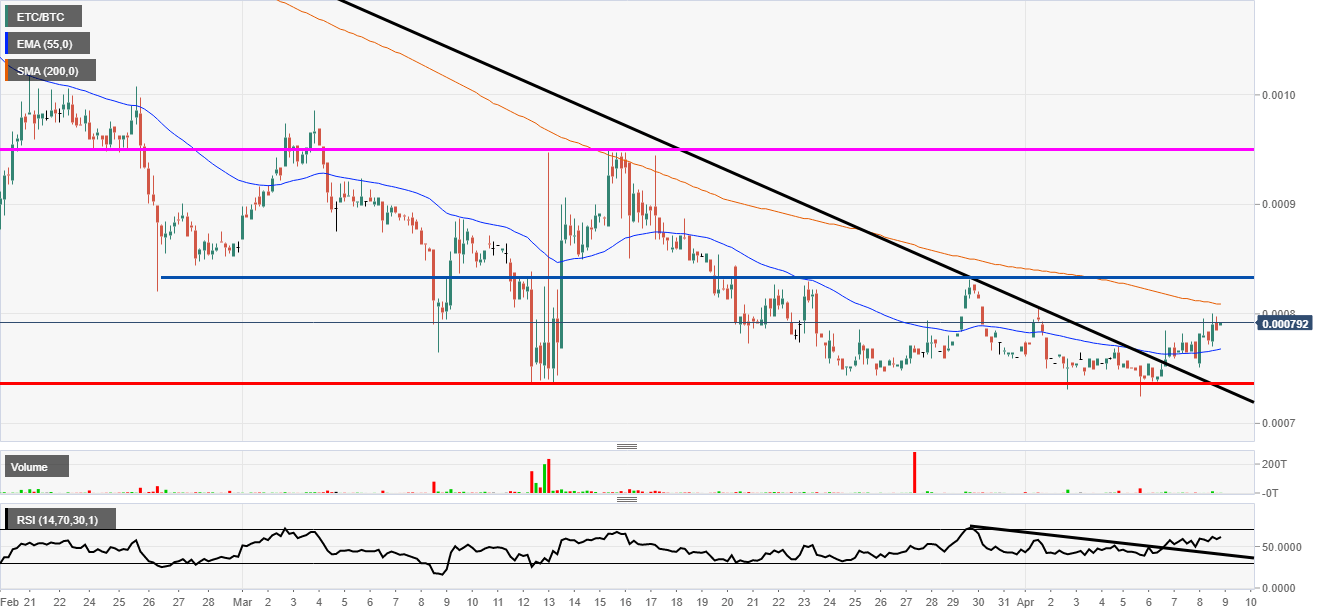
ETC/BTC 4-hour chart
Ethereum Classic has bounced off the lows to break a long term trendline. There are also some other signs of a move higher after the 55 4-hour exponential moving average broke to the upside too. Now the price is also heading toward the 200 simple moving average which has been useful in the past too.
Elsewhere, the relative strength index indicator trendline has also broken to the upside too. The only negative is the fact that the volume is soo low. It would help the bullish case if the volume picked up during any move higher. In terms of the next target up, 0.000835 would be the next resistance zone to watch out for if the bullish trend change is to continue.