- ETC/USD has three notable support levels on the downside at $4.40, $4.32 and $4.27.
- ETC/USD went up from $4.44 to $4.51 this Friday.
ETC/USD bears had full control of the market this Friday, following a bullish Thursday. This Thursday, the price of the asset went up from $4.44 to $4.51 and has since corrected itself around $4.44. The hourly price chart shows us that the price went up to $4.55, encountered resistance and then fell to $4.44 – breaking past support levels at $4.50 and $4.48.
ETC/USD daily confluence detector
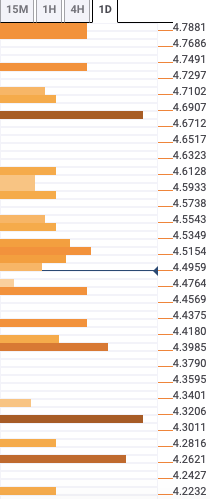
The daily confluence detector shows three robust support levels at $4.40, $4.32 and $4.27. $4.40 has one-day previous low and one-day Bollinger Band lower curve, while $4.32 has the one-week Pivot Point support one and one-day Pivot Point support two. Finally, $4.27 has the previous month low.
On the upside, the only resistance level of note is at $4.69, which has the one-day Bollinger band middle curve, 100-day Simple Moving Average (SMA 100) and one-day Pivot Point resistance two.
