- Ethereum Classic was one of the worst performers during the sell-off in cryptocurrencies.
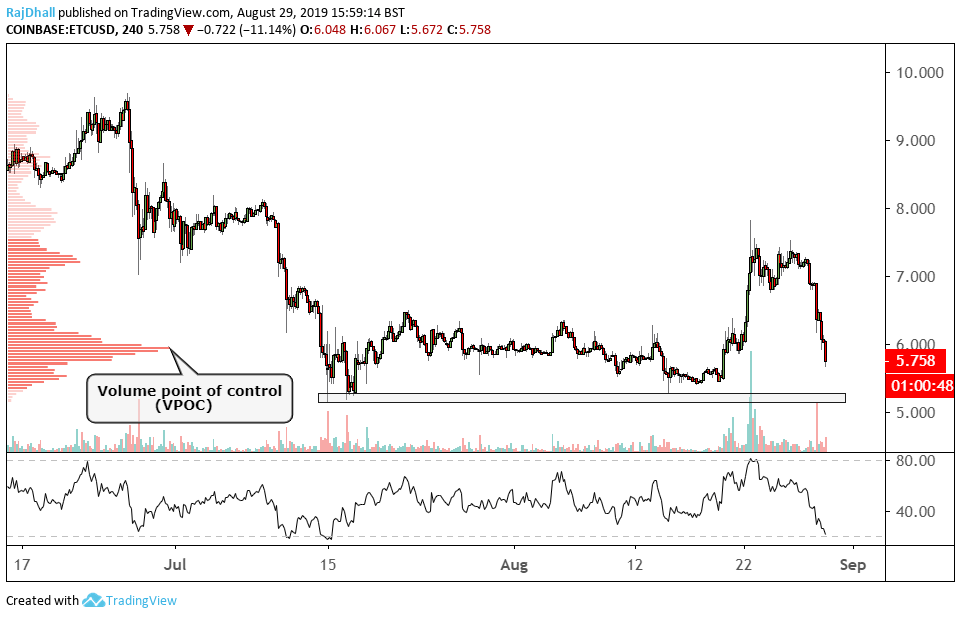
- There is a massive support level coming up that could halt the bearishness.
- The volume profile and RSI are showing signs that the bulls could come back in.
In the recent cryptocurrency sell-off, ETC/USD was one of the worst casualties.
At the moment the key area on the 4-hour chart above is the support zone just above the 5.000 psychological level.
On the left-hand side of the chart is the composite volume profile. The peak of the bell curve is called the volume point of control (VPOC) this is the point where most contracts have changed hands. At the moment you can see that price is headed toward that level. The reason why I pointed it out is that there is often a rejection at that point.
The RSI is also near the oversold area. On the 4-hour timeframe, there is often a reaction at the overbought and oversold areas in ETC/USD.
Lastly, the volume has also picked up on the sell side so it will be interesting to see what happens if indeed the bears manage to take the pair down to the 5.000 level.
