- A move above $175.00 is needed to improve the short-term picture.
- The significant support is created on approach to 170.00.
The second-largest cryptocurrency with the current market capitalization of $18.5 has resumed the sell-off during early European hours and touched an area below $170.00. While the coin has managed to recover to $171.70 by the time of writing the overall short-term trend remains bearish as long as the price stays below $175.00. ETH/USD is down nearly 4% in recent 24 hours.
Ethereum’s technical picture
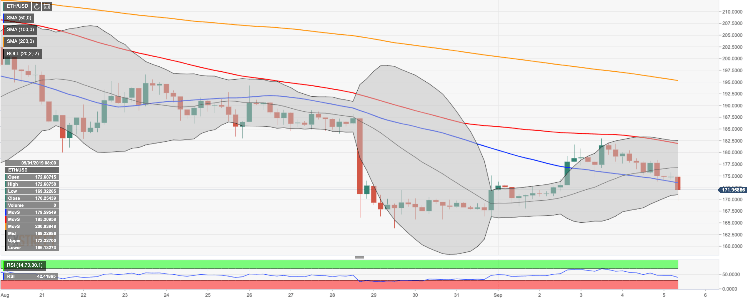
Looking technically, initial support is created by the lower line of Bollinger Band on 4-hour chart on approach to $171.00. Once it is out of the way, the sell-off is likely to gain traction with the next focus on psychological $170.00 and the intraday low of $169.63. Considering the downside looking RIS (Relative Strength Index), downside momentum is likely to continue on approach to the lower boundary of the recent consolidation channel at $167.00.
On the upside, the first resistance area awaits ETH bulls on approach to $175.00 (the middle line of 1-hour Bollinger Band and SMA100 (Simple Moving Average) 1-hour). However, the even stronger barrier comes at $177.30 (SMA50 1-hour), followed by psychological $180.00. Once it is cleared, the recovery may be extended towards $182.00 (SMA100 4-hour and the upper line of 4-hour Bollinger Band).
ETH/USD, 4-hour chart