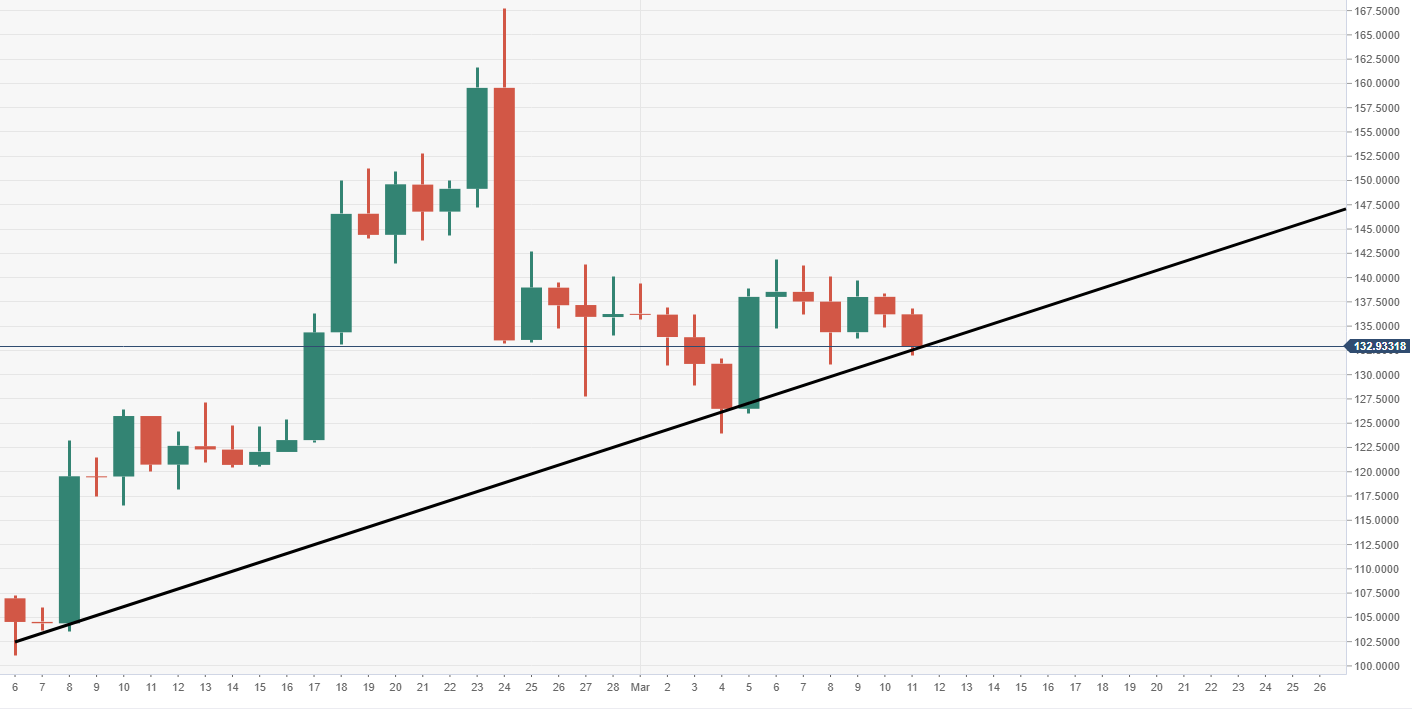
- Ethereum price on Monday is trading in the red, down some 2.5% in the session.
- An ascending trend line which has been in play since the start of February is being tested to the downside.
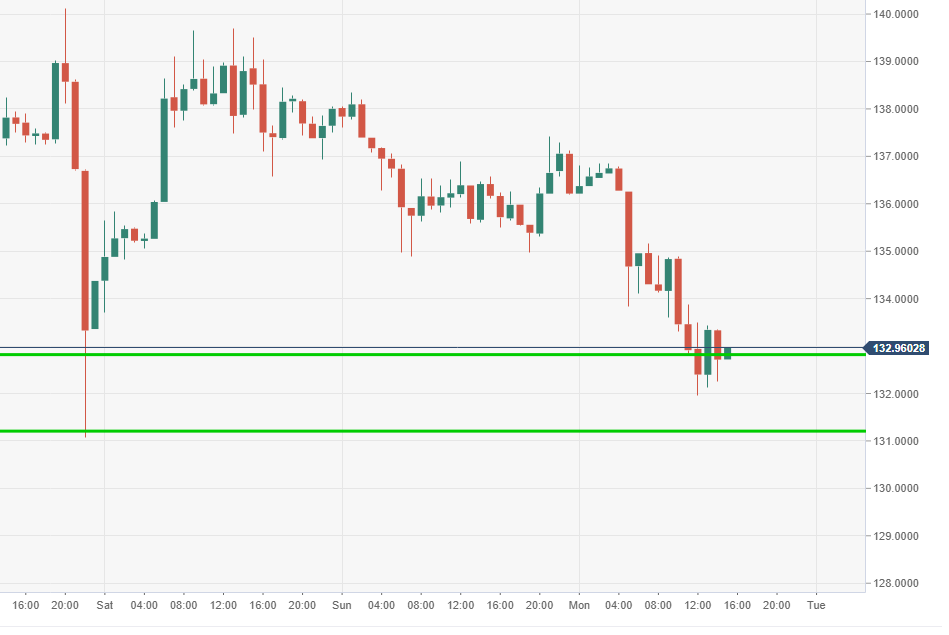
Spot rate: 132.90
Relative change: -2.50%
High: 136.85
Low: 131.95
Trends:
Daily SMA20: 139.08
Daily SMA50: 125.3
Daily SMA100: 122.51
Daily SMA200: 167.46
Levels:
Previous Daily High: 138.34
Previous Daily Low: 134.89
Previous Weekly High: 141.86
Previous Weekly Low: 123.9
Previous Monthly High: 167.77
Previous Monthly Low: 101.12
Daily Fibonacci 38.2%: 136.21
Daily Fibonacci 61.8%: 137.02
Daily Pivot Point S1: 134.62
Daily Pivot Point S2: 133.02
Daily Pivot Point S3: 131.16
Daily Pivot Point R1: 138.08
Daily Pivot Point R2: 139.94
Daily Pivot Point R3: 141.53
ETH/USD 60-minute chart
- Near-term buying observed around $131 price territory, a breach could open the door to a fresh wave of selling.
ETH/USD daily chart
- ETH/USD bears are testing a trend line which has been in play since early February to the downside.