- Ethereum (ETH) nursing losses of around 0.5%, through the mid-point of the session on Wednesday.
- ETH/USD price action has formed a bearish pennant pattern, subject to a potential extended move lower.
- It appears there is much in the way of barriers for a reclaim of the $200 mark again.
- A firm break of $195.00 for ETH/USD could open the door to a fresh wave of selling pressure.
ETH/USD 60-minute chart
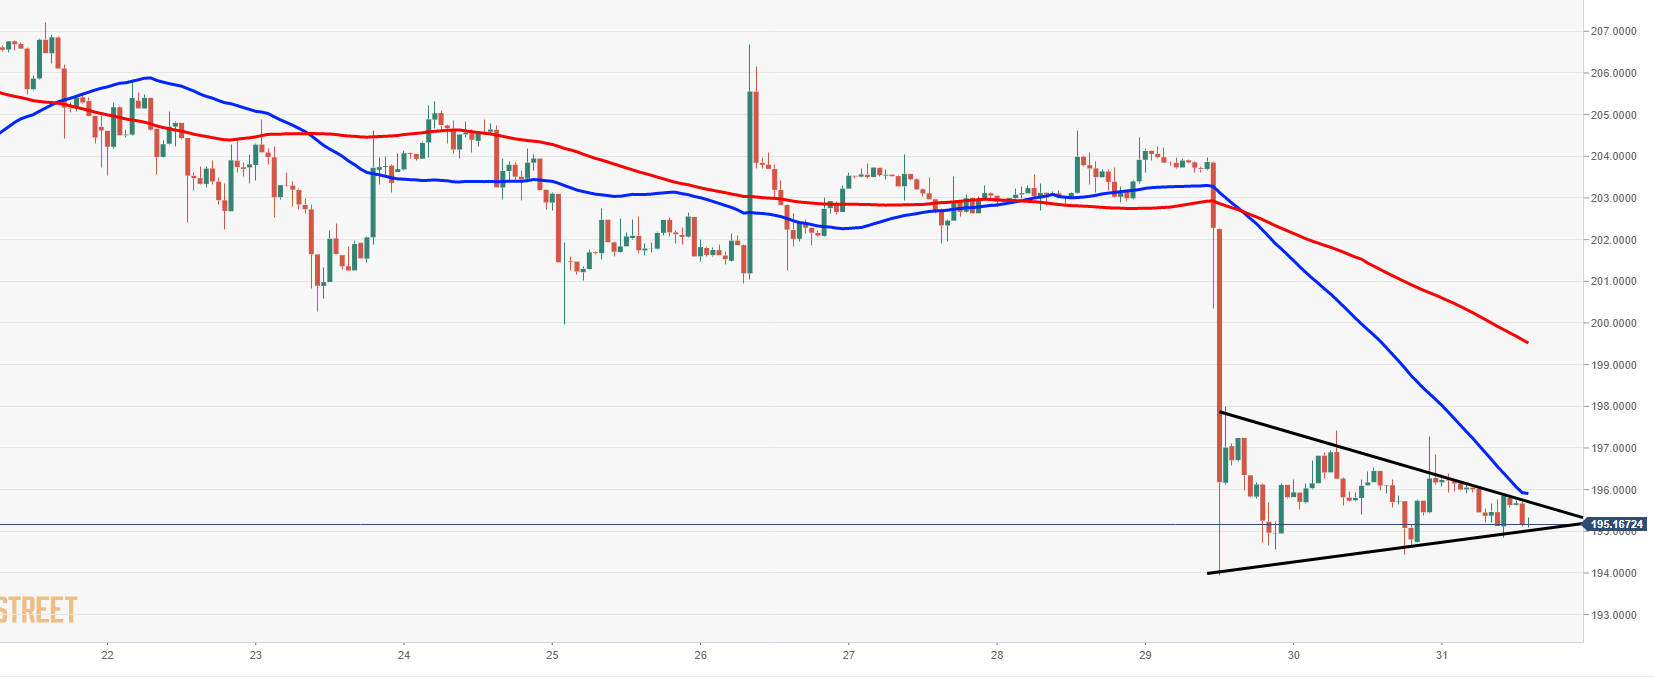
Spot rate: 195.26
Relative change: -0.46%
High: 197.41
Low: 194.45
Trend: Bearish
Support 1: 195.00, lower part pennant pattern.
Support 2: 194.61, 30 October low area & daily pivot point support.
Support 3: 193.05, daily pivot point support.
Resistance 1: 195.70, upper part of pennant & 50MA (60-minute).
Resistance 2: 197.31, resistance (60-minute).
Resistance 3: 198.97, daily pivot point resistance.
