- ETH/USD under selling pressure below $135.00.
- Digital Delphi published research on Ethereum.
ETH/USD is changing hands at $134.40, down 1.3% since the beginning of Monday. The coin with the market value of $14.3B is moving down amid growing volatility.
What’s going on
Meanwhile, experts of Digital Delphi found out that 7542 addresses hold over 80% of all Ethereum coins. Each address has over 1000 ETH. As of March 3, about 2.3M ETH were tied in smart-contracts of decentralized financial applications.
Also, they noticed that ETH lost 19% of its value on average within 30 days after each hard fork. However, Constantinople seems to stand apart as this time the price of the second largest coin has barely changed.
Ethereum’s technical picture
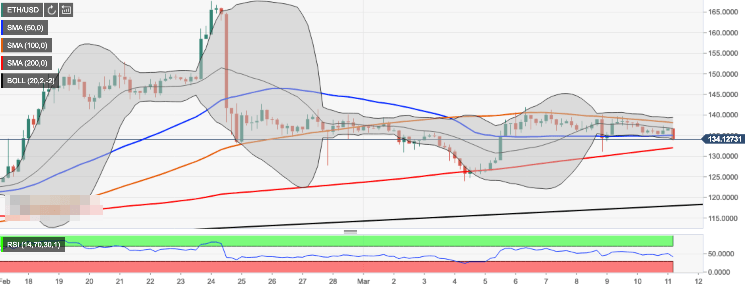
Looking technically, ETH/USD broke below congestion zone $135.00 strengthened by SMA50, 4-hour chart. This development darkened the short-term technical picture and opened up the way towards the next support zone $125.30 (DMA50) and $124.45 (lower boundary of Bollinger Band on a daily chart).
On the upside, the coin needs to return above $135.00 as soon as possible to mitigate the initial downside pressure. Once it happens, the focus will shift onto $140.00. The price has been trying to take it out since March 6 with no success so far. This resistance is strengthened by the upper boundary of Bollinger Band on the 4-hour chart. A sustainable move higher will serve as a pre-condition to the extended recovery with the next focus on $150.00.
ETH/USD, 4-hour chart