- The positioning on Bitfinex implies that retail traders bet on ETH growth.
- The technical picture confirms the bullish scenario at this stage.
Ethereum (ETH) has resumed the recovery after a consolidation period at the beginning of the week. The price touched the intraday high of $375 and retreated to $368 by the time of writing. Despite the sell-off, ETH/USD is still trading with a strong bullish bias. The price has increased by nearly 10% on a day-to-day basis and over 5% since the beginning of Thursday.
Retails traders bet on ETH growth
The long leveraged ETH positions on Bitfinex is moving close to 100%, which means the retail traders bet on the price increase. Notably, the percent of long positions have been consistently above 90% and started climbing after the market sell-off took ETH/USD down to $300. A strong tilt towards long positioning might signal that the retail investors are optimistic about the nearest future of the second-largest digital asset.
Percentage of long and short positions
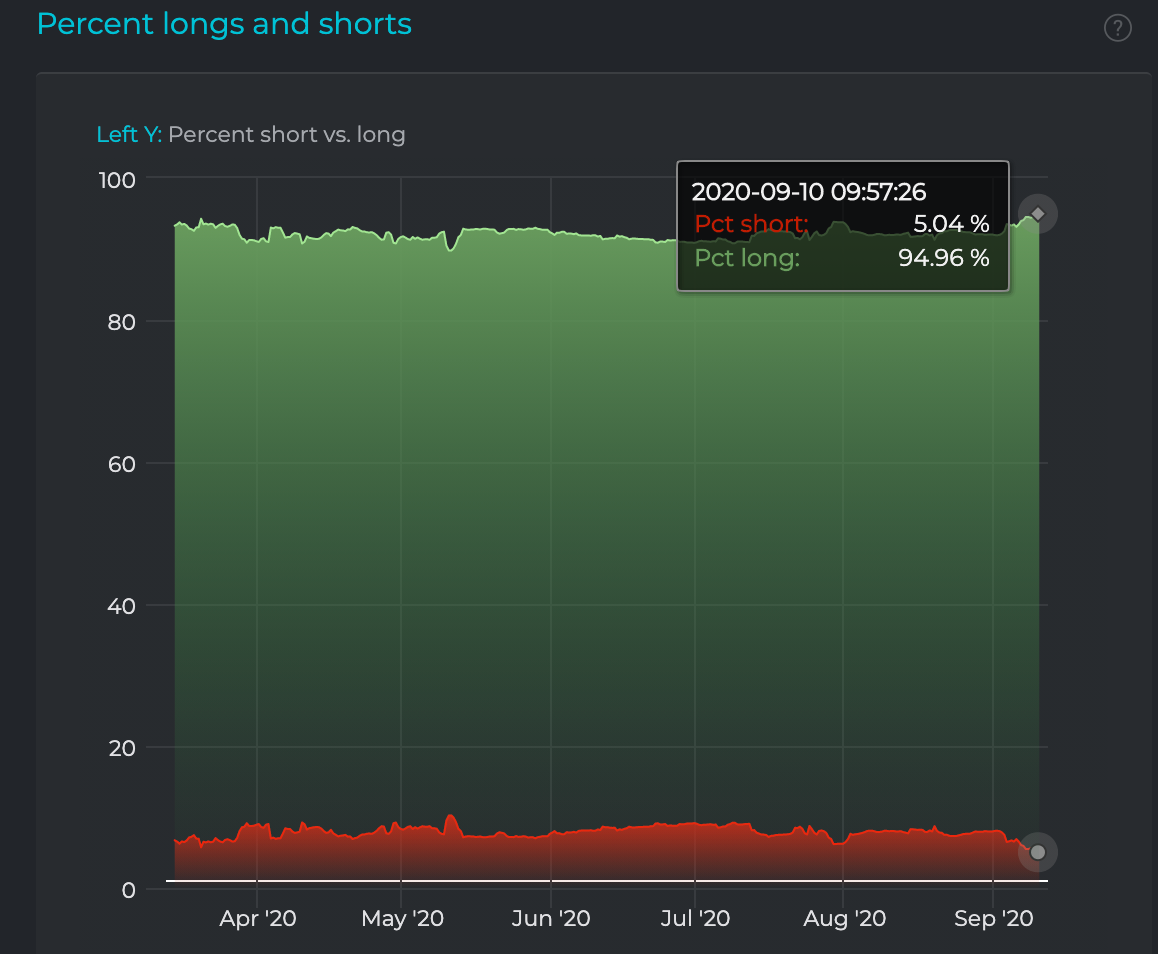
At first sight, this signal is bullish for ETH as it means that the growing number of traders believe in bullish development and want to buy. However, this coin has a flipside. As the percentage of longs moves closer to 100%, the market becomes strongly overbought, creating substantial risks of long squeeze and a sharp downside correction.
Let’s have a closer look at ETH/USD technical picture to find the answers.
Some pain ahead?
On-chain metrics provided by Intotheblock, there’s been a spike in the number of new addresses on September 6. Basically, this development means that more people joined the market and may be ready to put some coins to their wallets. Considering that this indicator serves as a leading indicator to price, the upside momentum may gain traction.
The number of new ETH addresses
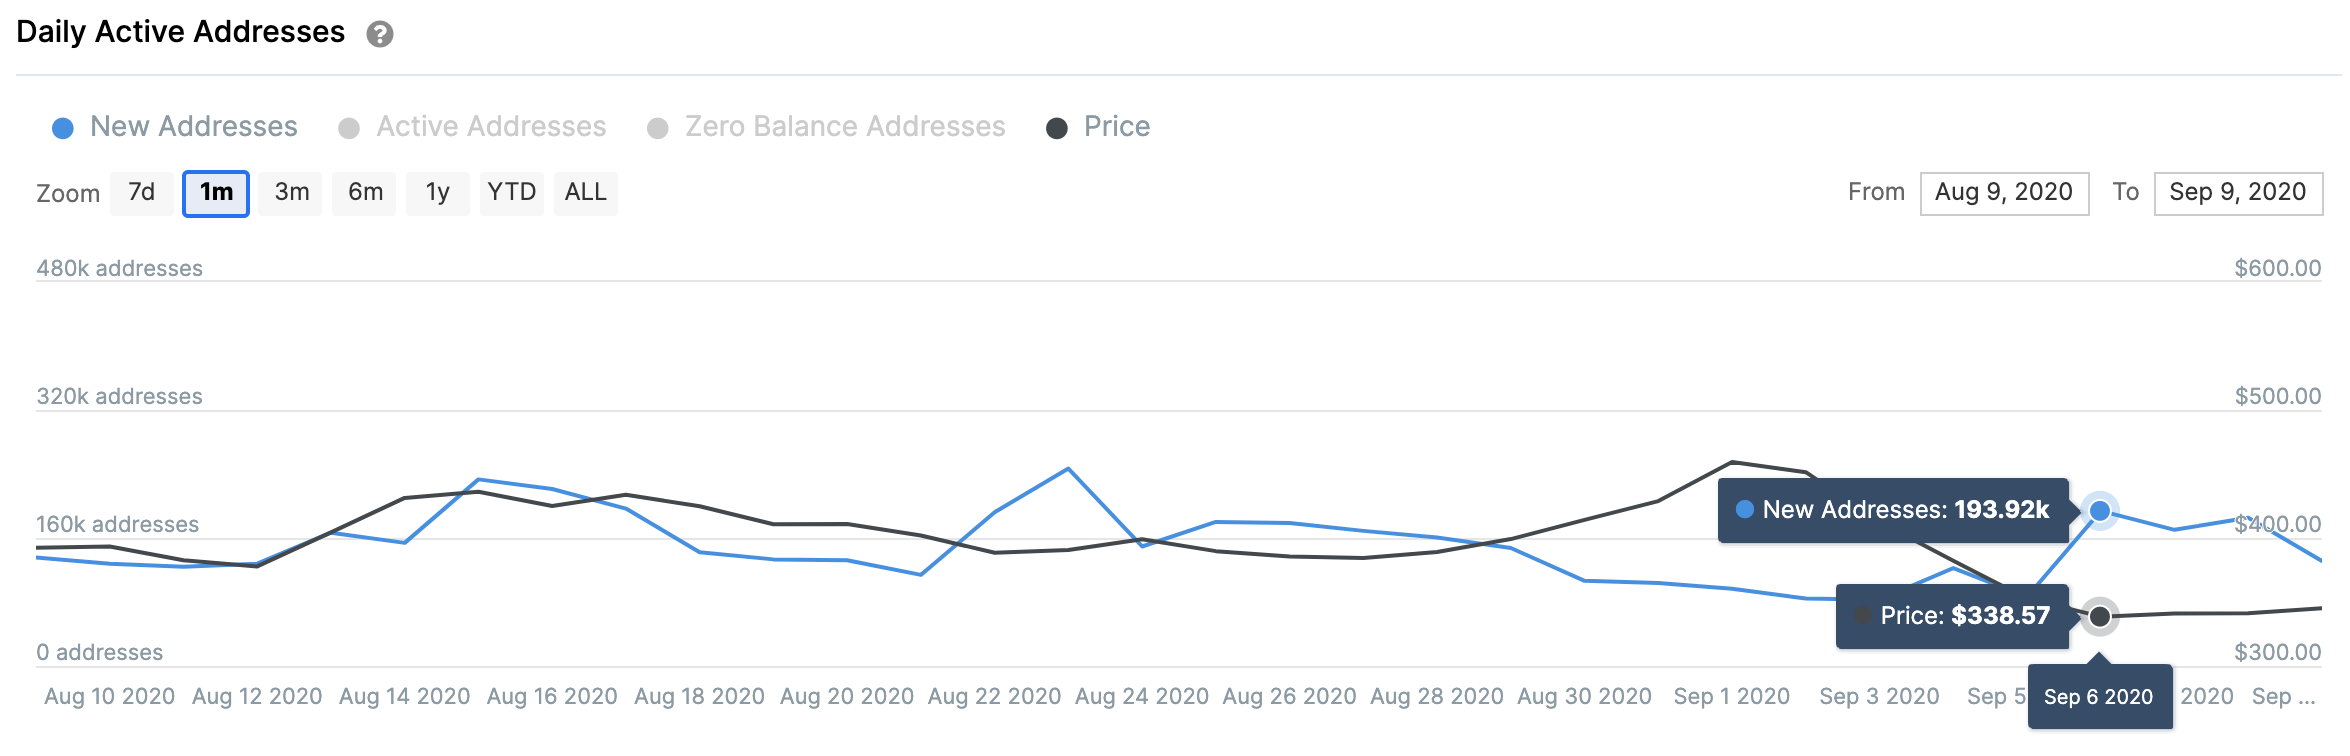
Source: Intotheblock.
ETH/USD: The technical picture
Meanwhile, on the intraday chart, ETH/USD broke outside the triangle pattern. A sustainable move above its upper boundary at $350 has improved the short-term technical picture and allowed the price to retest the 4-hour SMA50 at $373. The bulls failed to take this barrier at the first try, but the short-term momentum remains optimistic if the price manages to stay above the broken resistance at $350 and verify it as a support.
Once the above-said SMA50 is out of the way, the recovery may be extended to $390 (4-hour SMA100) and psychological $400.
ETH/USD 4-hour chart
-637353211519553300.png)
On the daily chart, ETH/USD is moving inside an upward-looking channel limited by the bullish trendline from September 5 low and the daily SMA50 at $380. A sustainable move above this area will confirm the bullish scenario and open up the way to $400 and eventually $440. On the other hand, the sell-off below the trendline at $333 will negate the positive outlook and bring the recent low of $300 into focus.
ETH/USD daily chart
-637353211754273237.png)
To conclude: The short-term technical picture implies that ETH/USD may continue moving upwards with the vital resistance area at $380-$400. Once it is passed, the upside momentum may gain traction. Market positioning and on-chain data confirm the positive scenario. Meanwhile, a failure to stay above $333 will signal that the bulls lose control.
