- ETH/USD licks its wound after heaviest declines in one week.
- Short-term falling channel, bearish oscillators suggest further weakness.
- Five-week-old horizontal area, channel support will be tough nuts for bears to crack.
ETH/USD nurses the previous day’s losses, the heaviest in a week, while picking up bids to $1,490 amid initial Wednesday. In doing so, the altcoin portrays a bounce inside a bearish chart pattern.
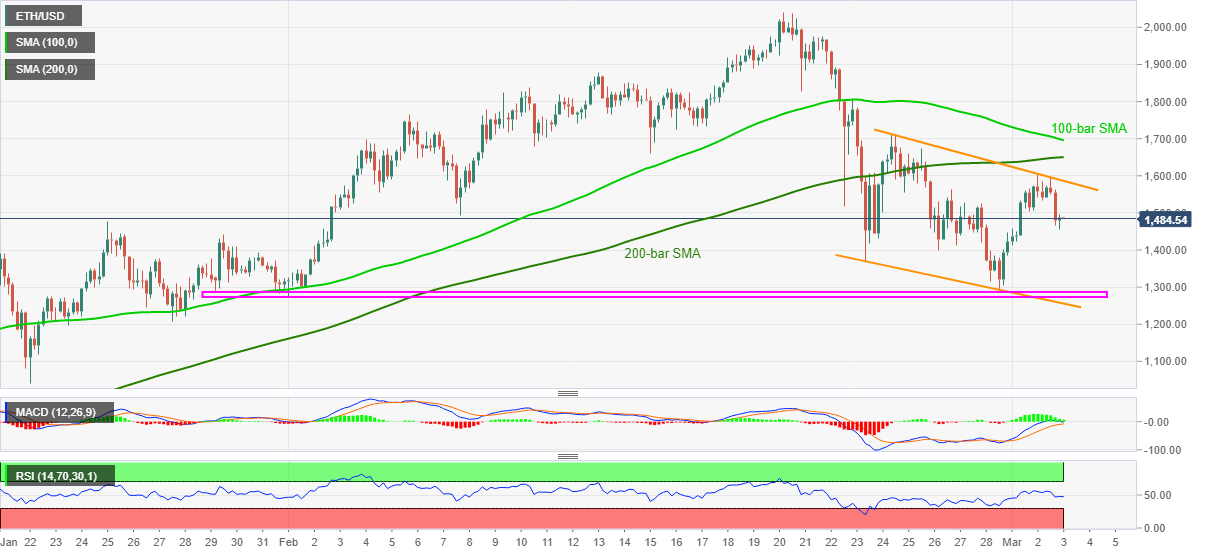
Not only a downward sloping trend channel from February 23 but descending RSI and continuously receding strength of the bullish MACD also suggest extra pullback of the ETH/USD prices.
As a result, intraday sellers can eye the previous Tuesday’s low near $1,370 but a horizontal area from late-January, as well as support line of the stated channel, respectively around $1,275 and $1,260, could challenge the ETH/USD bears afterward.
In a case where the quote drops below $1,260, odds of its south-run to January 22 low near $1,040 and the $1,000 threshold can’t be ruled out.
Meanwhile, the cryptocurrency pair’s extra rise will have to defy the stated bearish chart pattern by crossing $1,590 resistance, not to forget the $1,600 round-figure, to recall the ETH/USD buyers.
Though, key SMAs around $1,650 and $1,700 will test the upside momentum targeting the $2,000 and the record top, marked in February around $2,040.
ETH/USD four-hour chart
Trend: Further weakness expected
