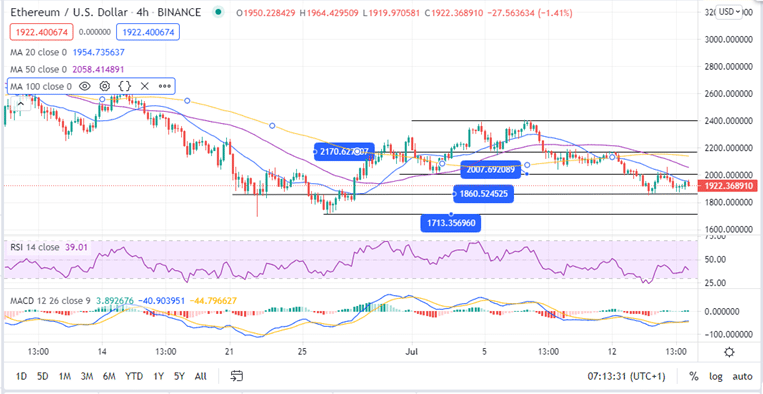
Ethereum price opened the day in the green as bulls attempted to launch an upswing beyond the $2,000 resistance level. ETH lost 1.88% against the dollar over the last 24 hours with bears determined to stretch the bearish leg that started on July 07. This was after exploring levels around $2,400 and held support around $2,170. At the time of writing Ethereum was trading in the red at $1,922.
- Are you looking to buy crypto? Have a look at the Best Cryptocurrency Brokerswho for more details
Ethereum Price Stuck Between the 20-day SMA and the $1,860 Support
The four-hour chart shows that the Ethereum price has been struck between the 20-day SMA and the $1,860 support line. This points to a sideways price action amid as the market indecision becomes apparent. The appearance of three doji sticks over the last three trading sessions yesterday validate the indecision in the market as the Ethereum bulls and bears cancel out.
Note that on the same four-hour chart, Ethereum price presented a signal for an upward price action, suggesting that ETH uptrend could be seen in the near term. Moreover, the Moving Average Convergence Divergence (MACD) indicator validates Ethereum price consolidation by its sideways movement. In addition, the position of the MACD line (blue) above the signal line hints at a possible uptrend.
Ethereum Price (ETH/USD) Four-Hour Chart
Ethereum Price Uneventful as Bulls and Bears cancel
The market indecision displayed by the Ethereum price is validated by the Bulls and Bears Indicator by IntoTheBlocks. Generally, the 7-day difference between bulls and bears is negative pointing to more sellers than buyers. The chart indicates that the total volume of ETH tokens traded by the bulls and bears. Note that, the most important information here is the differences in trading volumes by the bulls and bears.
ETH Traded by Bulls and Bears Between June 22 and July 15
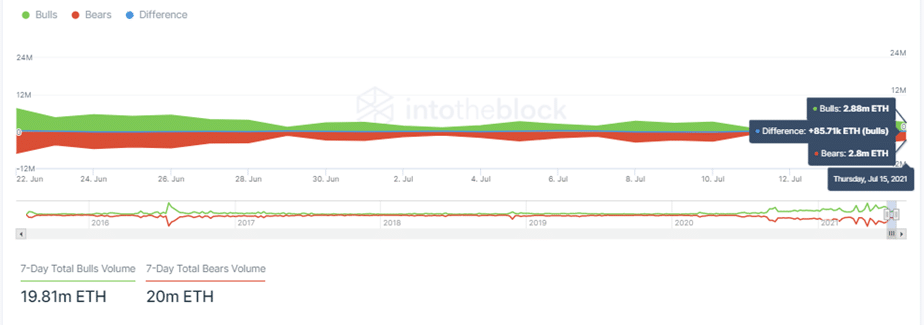
The chart indicates that bears traded approximately 190,000 million more ETH than bulls over the last 7-days. However, this difference, as shown by the blue line in the middle of the chart is neutral (at zero) pointing to a consolidating market as the pressure from bulls and bears cancels out. The indecision in the market yesterday is validated by the fact that bulls traded only 85,700 more ETH than bulls. In general, the equilibrium between the buyers and sellers points out to an indecision in the market.
What is Likely to Happen?
Note that if the market moves in favour of bulls, they should target overcoming the 20-day SMA towards the $2,000 psychological level. A daily close above this level could bolster bulls to push the price to $2,200 which corresponds to the 100-day SMA and even test the $2,400 two-week high.
-Check out our guide for credible crypto signals.
If the Ethereum price favours bears, ETH could retest the $1,860 crucial support level, before a further drop to $1,713 retesting the June 26 low.
Looking to buy or trade Ethereum now? Invest at eToro!
Capital at risk
