- Ethereum is bullish, but technical indicators are sending bear signals in the medium-term.
- Several support areas at $530 and $520 will continue to hold in the near-term.
After surviving the hack attack on Bithumb exchange, the crypto market has engaged forward gears. Ethereum price is also nearing a breakout at the narrow end of the rising wedge pattern. It is also supported at $520 which also coincides with the ascending trendline.
The recent overarching declines had ETH/USD trading in the $460 range. However, the buyers entered and the crypto has sustained an uptrend breaking above the resistance at $480, $520 and $530 respectively. The buyers breached another short-term resistance at $540 but selling pressure on Thursday has pushed for lower corrections.
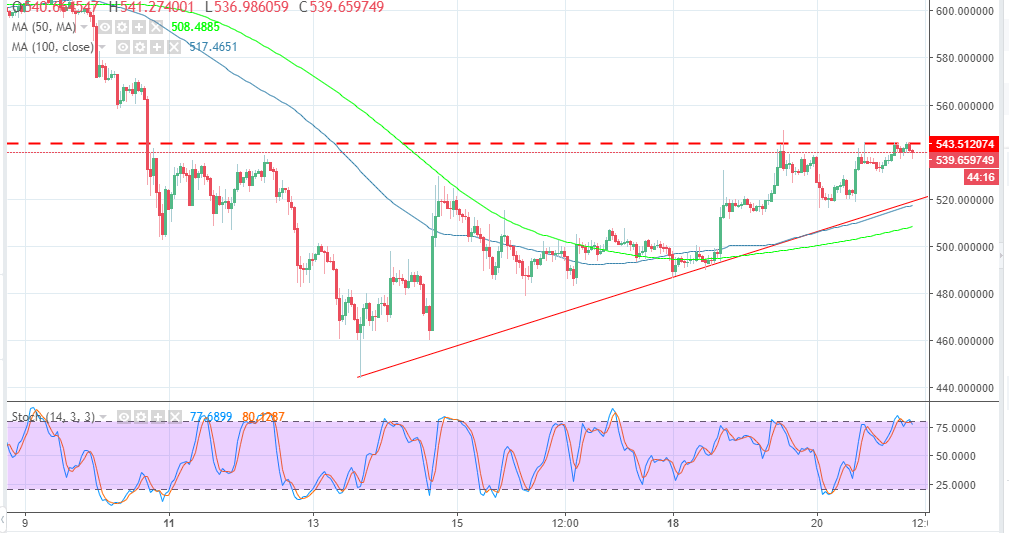
Ethereum is currently trading at $539 while the technical indicators are showing bear pressure movements in the medium-term. The moving averages on the 1-hour timeframe chart signal selling entrance while the stochastic, although at 75%, it is pointing south. The MACD, on the other hand, is in the positive territory, its signals are bearish in the short-term as well. The buyers must put their best foot forward and avoid declines below $535. Significantly, the support areas at $530 and $520 will continue to hold.
ETH/USD 1-hour chart