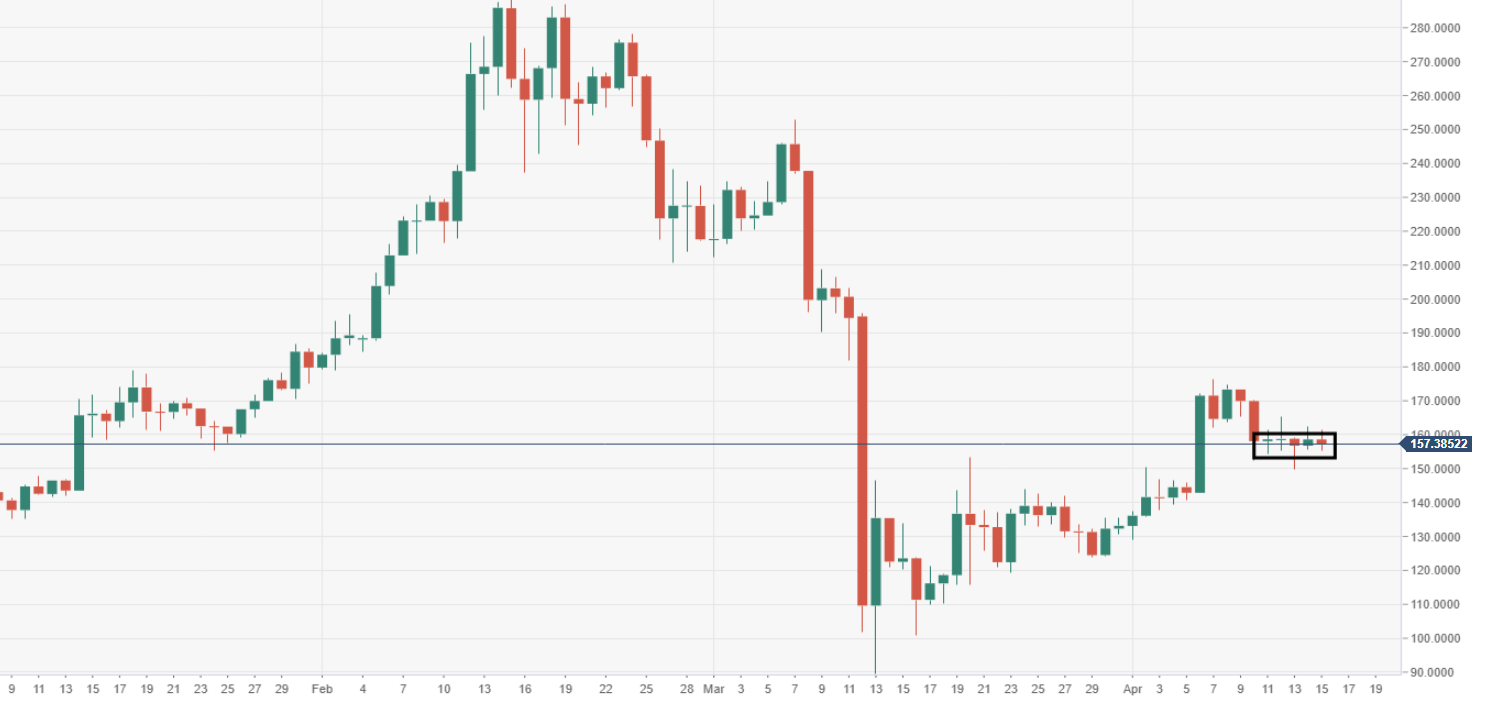
- Ethereum price is trading in the red by 3.35% in the session on Wednesday.
- ETH/USD is moving within a very tight range block, subject to a breakout.
- The price to move into a definitive trend needs to break down $200 to the upside, or $150 to the downside.
ETH/USD daily chart
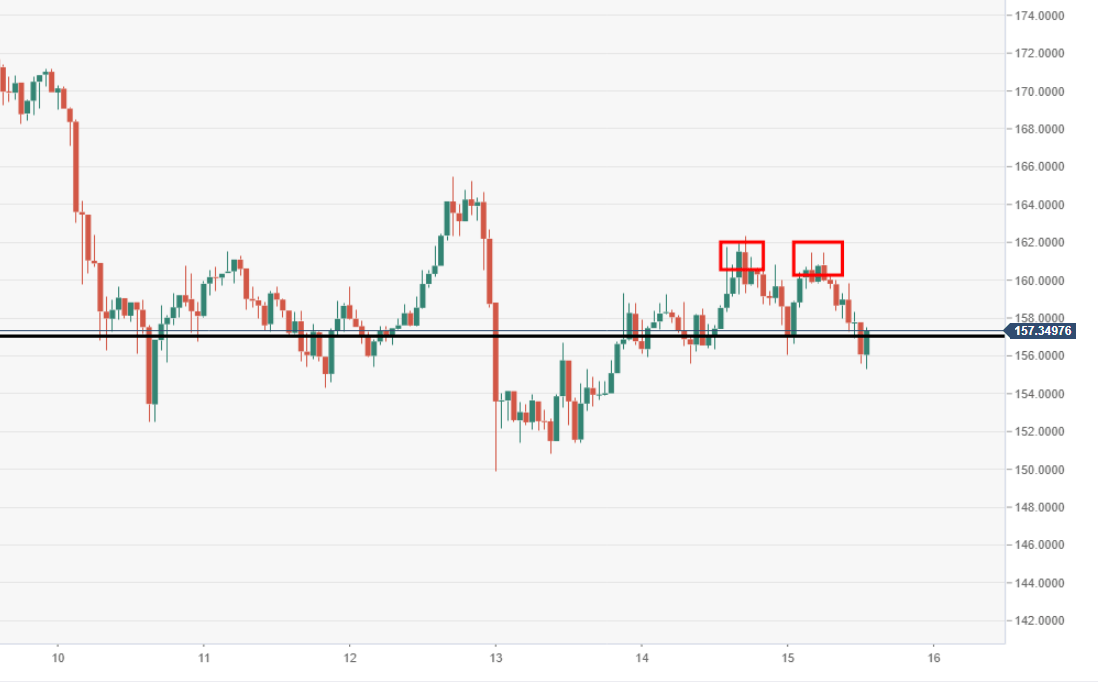
Price action has been moving within a range of $162 to the upside and $155 to the downside, over the last five days. A breakout of this to the south, would see the price retesting March lows down at around $100.
ETH/USD 60-minute chart
A double top formation is viewable via the 60-minute chart view, the neckline eyed at $158-156. A breakout and retest is underway.
Spot rate: 157.44
Relative change: -0.75%
High: 161.44
Low: 157.49
