- ETH/USD dipped back inside the 20-day Bollinger Band.
- The SMA 50 is about to cross over the SMA 200 and chart the golden cross pattern.
ETH/USD daily chart
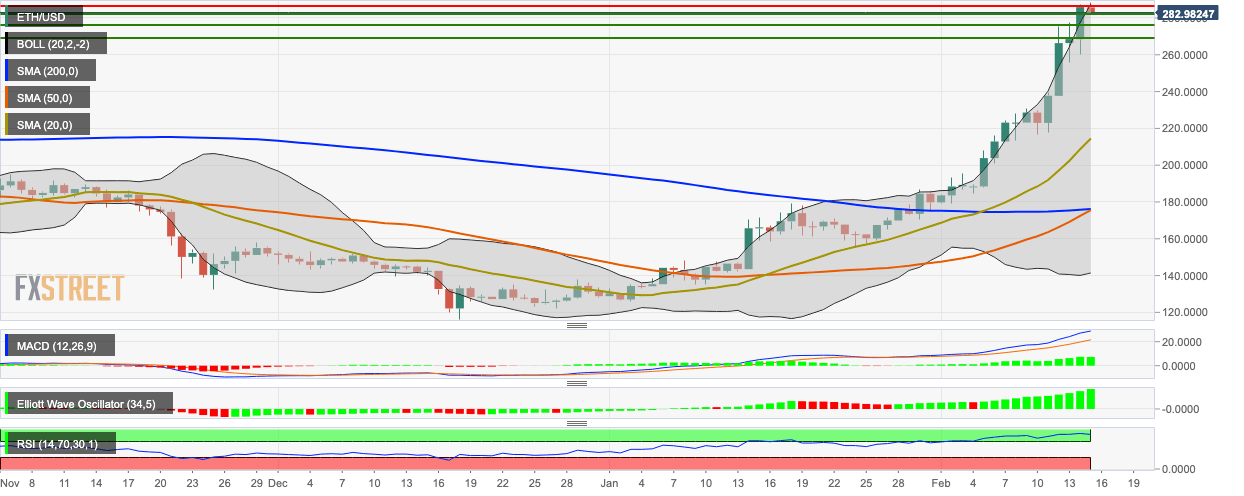
ETH/USD bears took control following four straight bullish days. ETH/USD dropped from $286 to $282 in the early hours of Saturday. In the process, ETH/USD has dipped back inside the 20-day Bollinger band, indicating that the price is no longer overvalued. However, the RSI indicator is still trending around 79 deep in the overbought zone, so further drop could be expected.
Despite this, there are quite a lot of indicators that show that the overall market sentiment is overwhelmingly bullish. The MACD indicates increasing bullish momentum, while the Elliott Oscillator has had 11 straight green sessions. Finally, the SMA 50 is crossing over the SMA 200 to chart the extremely bullish golden cross pattern.
