- Ethereum price is pivotal at the critical $500 level.
- The short-term support at $480 is also a breakdown towards the demand zone $470.
Ethereum price broke the support at $470 yesterday but found another strategic support at $460 which is the lower band of the Bollinger bands. It formed an engulfing bullish candle that spiked through the critical resistance zone at $500 and event attacked $520 in the subsequent upside corrections. ETH/USD traded highs of $525 marked by the upper band of the Bollinger bands before settling in a bullish flag pattern.
The cryptocurrency opened trading on Friday at $519.85 compared to the opening on Thursday at approximately 479 to show that there is a higher concentration of buyers today. However, the price rejected the highs at $525 and declined to test the critical zone at $500 before bouncing towards $510 followed by further lower corrections that are currently supported at $485.
At the moment, Ethereum is approaching the demand zone above $480, besides it could breakdown towards yesterday’s demand zone at $470. On the flipside, a bullish momentum could take the price back above the critical $500 which could open the door for a retracement to the upper supply area at $525. There are a couple of breakouts, $500 to the upside and $480 to the do the downside.
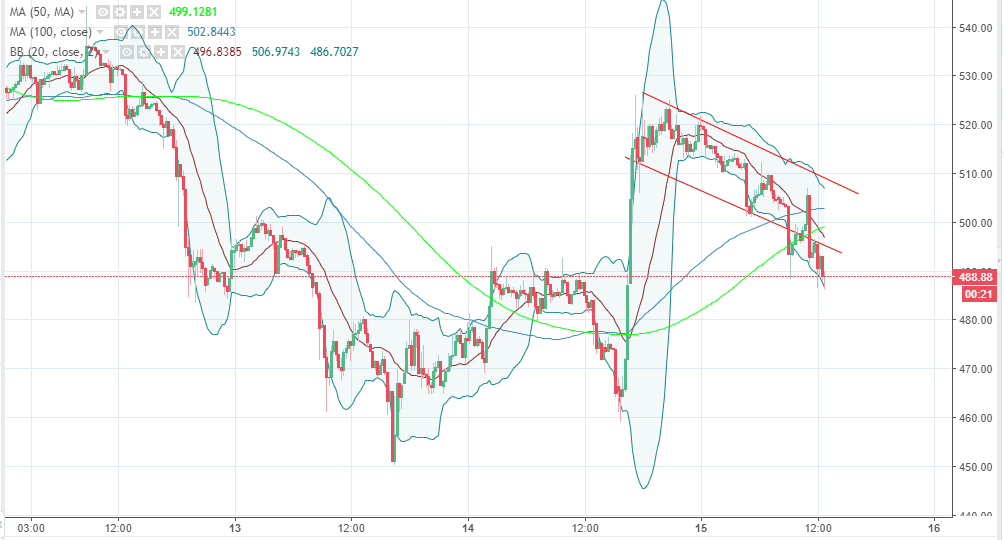
ETH/USD 15-minutes chart