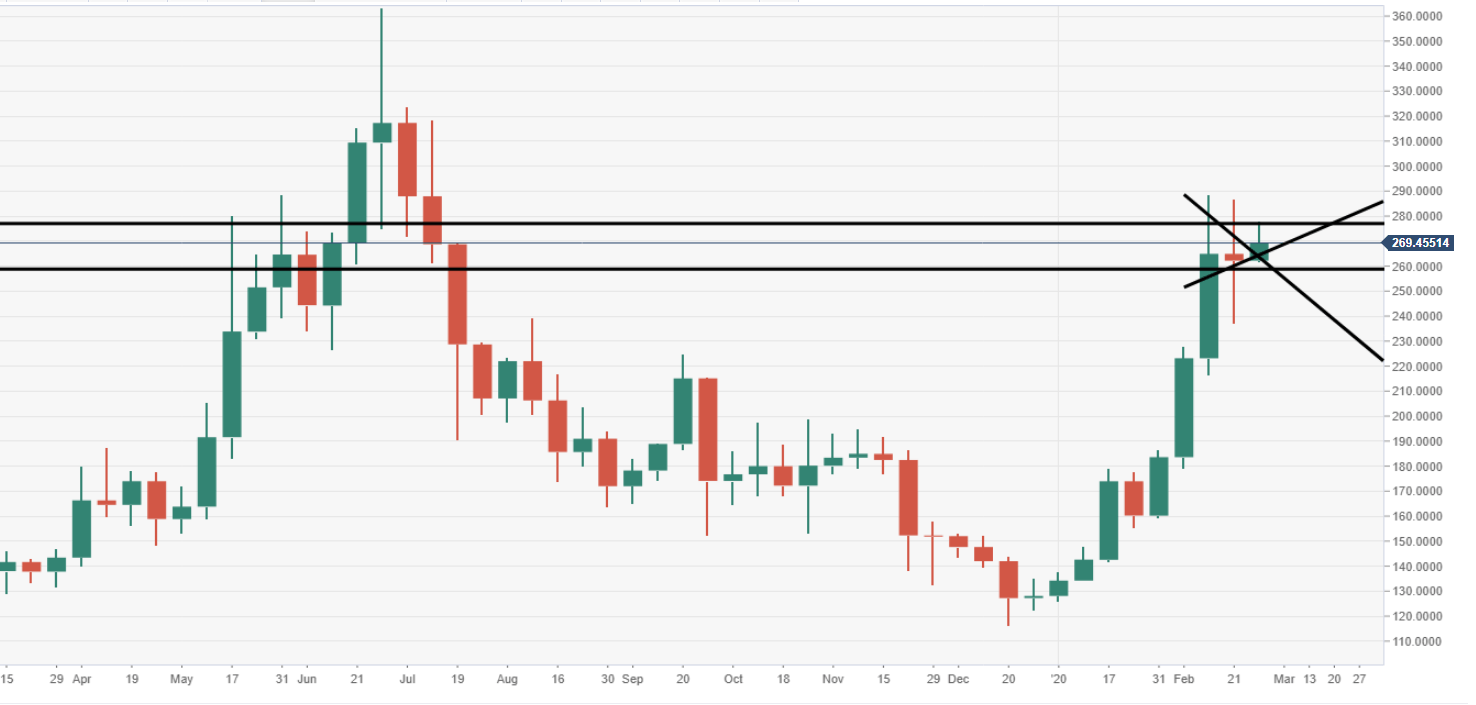
- Ethereum price is trading in the red by 2.10% in the session on Monday.
- ETH/USD price action is moving within a narrowing pennant structure, room for the bulls to capitalize.
- Critical support should be noted via the $250-40 price range, propping up ETH.
ETH/USD weekly chart
Weekly resistance should be noted at the range of $270-90, a breakdown here should invite a strong wave of buying momentum.
ETH/USD daily chart
A bullish pennant is viewable via the daily, ETH/USD has been moving within this since 14 February.
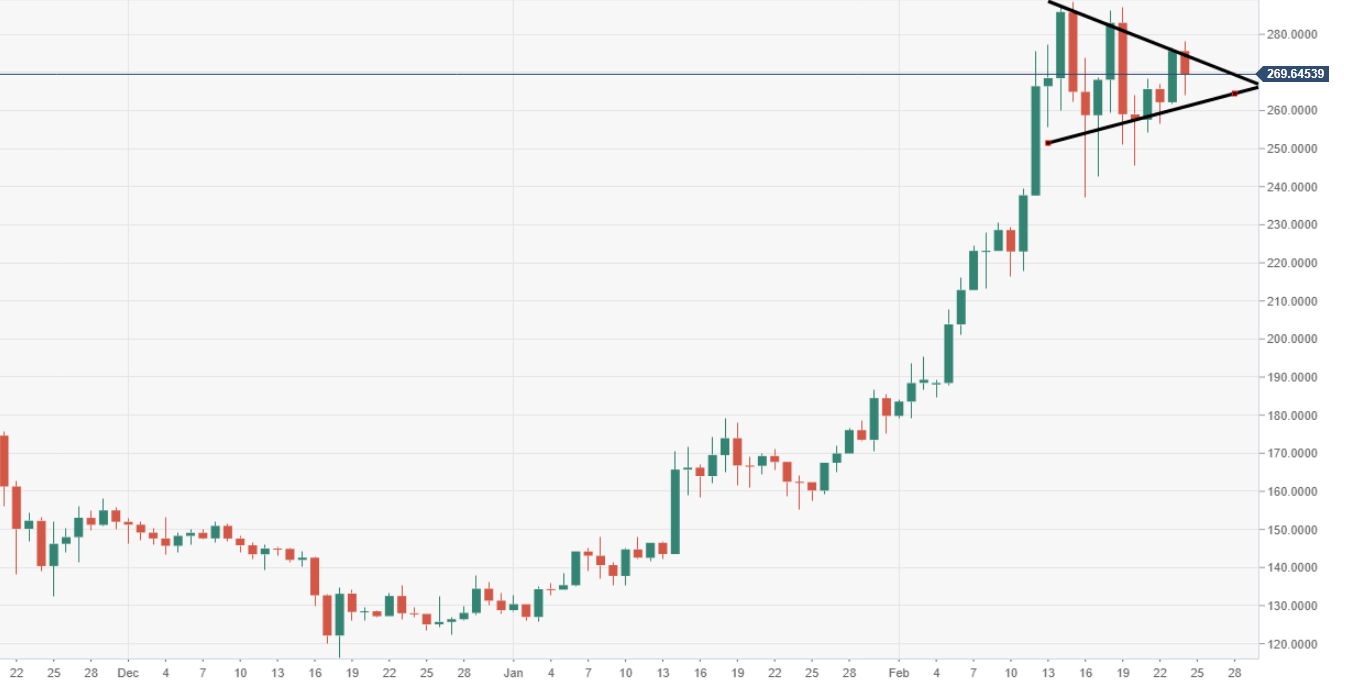
Spot rate: 265.83
Relative change: -2.10%
High: 278.07
Low: 264.01
