- ETH/USD has gone up from $168.50 to $169.70 so far this Saturday.
- The relative strength index (RSI) indicator is trending along the oversold zone.
Ethereum bulls managed to start strong this Saturday following four straight bearish days. ETH/USD has gone up from $168.50 to $169.70 so far this Saturday. Over the last four days, ETH/USD has fallen from $188.50 to $168.50, charting a 10.60% drop in price. The hourly breakdown shows us that the price fell to $167.55, where it found support and bounced up to $169.80. ETH/USD trended there horizontally for a bit and then fell to $167.65. The bulls then took control and put the price up to $169.70.
ETH/USD daily chart
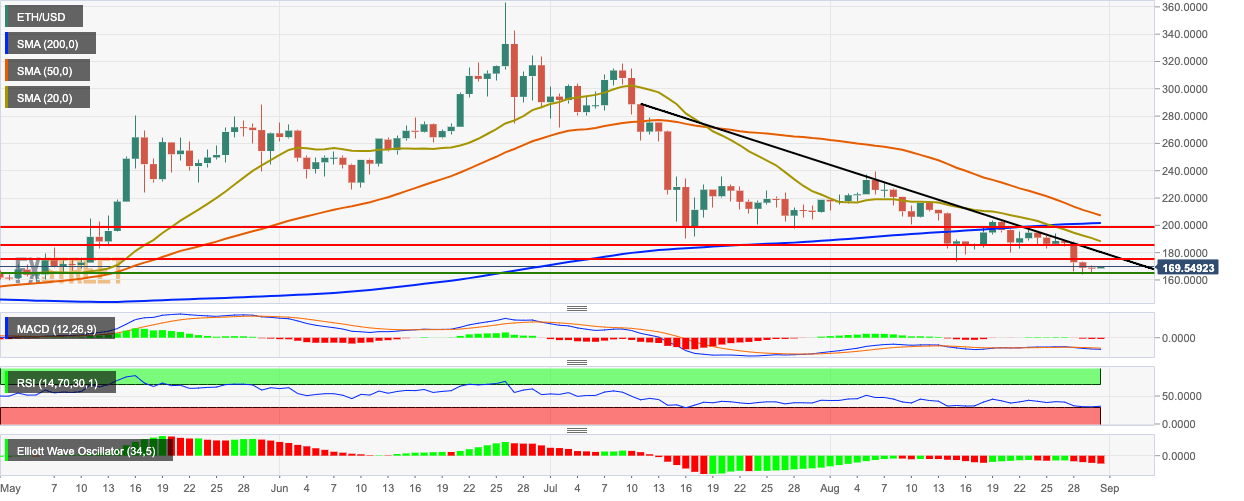
ETH/USD daily price chart has found resistance at the downward trending line and is trending below the 200-day simple moving average (SMA 200), SMA 50 and SMA 20 curves. The SMA 200 is looking to crossover the SMA 50 curve and chart the death cross pattern. The Elliott oscillator shows four straight bearish sessions while the moving average convergence/divergence (MACD) indicator shows three consecutive bearish sessions. The relative strength index (RSI) indicator is trending along the oversold zone.
