- ETH/USD is currently struggling to stay above $260.
- The RSI indicator has dipped from the edge of the overbought zone to 59.50 over the last two days.
ETH/USD daily chart
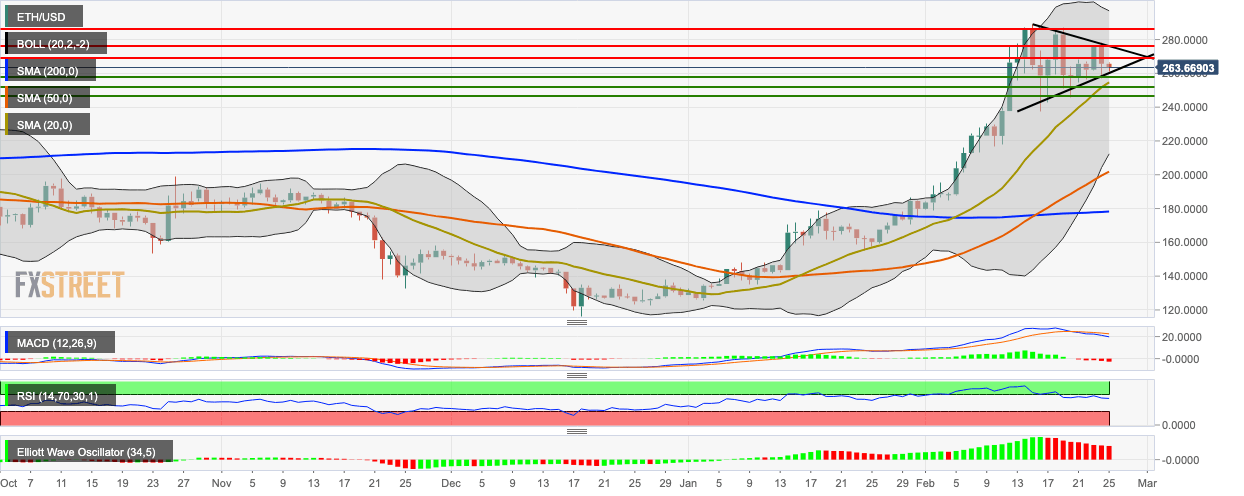
ETH/USD bears retained control for the second day running as the price of the asset dipped from $265.80 to $262.75 as the price continued to consolidate in a triangle formation. The bulls will need to fight back to ensure that the $260 support level isn’t breached. The 20-day Bollinger jaw has considerably narrowed to indicate decreasing price volatility. Both the MACD and Elliott Oscillator indicate increasing bearish momentum. The RSI indicator has dipped from the edge of the overbought zone to 59.50 over the last two days following bearish price action.
