- Ethereum price on Friday is trading with gains of just some 2.50%, as the bulls try to prevent further downside pressures.
- ETH/USD price action is moving within a bearish flag structure, subject to further potential moves south.
The Ethereum price in the latter stages of trading on Friday is trading up with gains of 2.50%, as the price tries to stabilize following the pressure from the bear seen. It has dropped from heights of around $320 down to recent lows this week at $260.
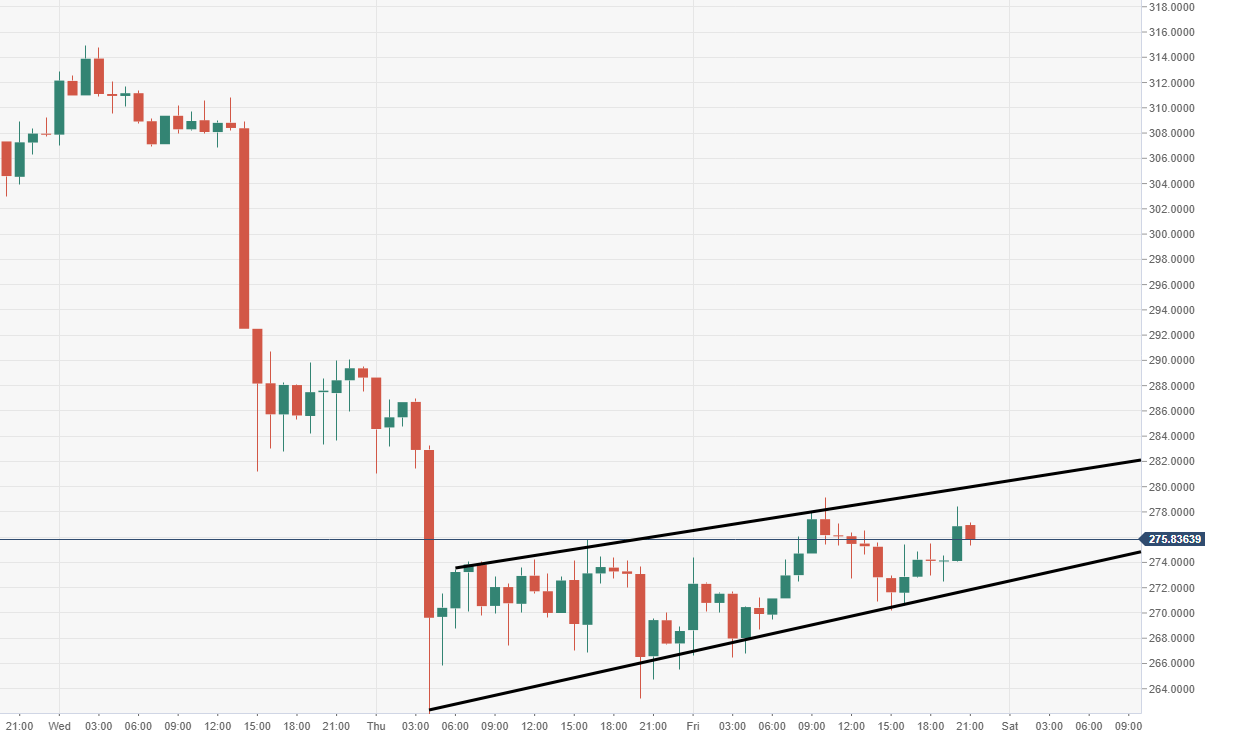
ETH/USD price action via the near-term view, 60-minute chart, has formed a bearish flag structure. The noted pattern comes after a brutal period of selling, as Ethereum consolidates somewhat for now.
To the downside, the next major area of support is seen down at $230. The noted zone supported the price from early May to the start of June. Bulls had used this to start their most recent bull run, which of late has lost momentum.
ETH/USD 60-minute chart