- Ethereum price is trading in the red by 9.50% in the session on Monday.
- ETH/USD continues to move within a narrowing structure, at risk of an explosive breakout.
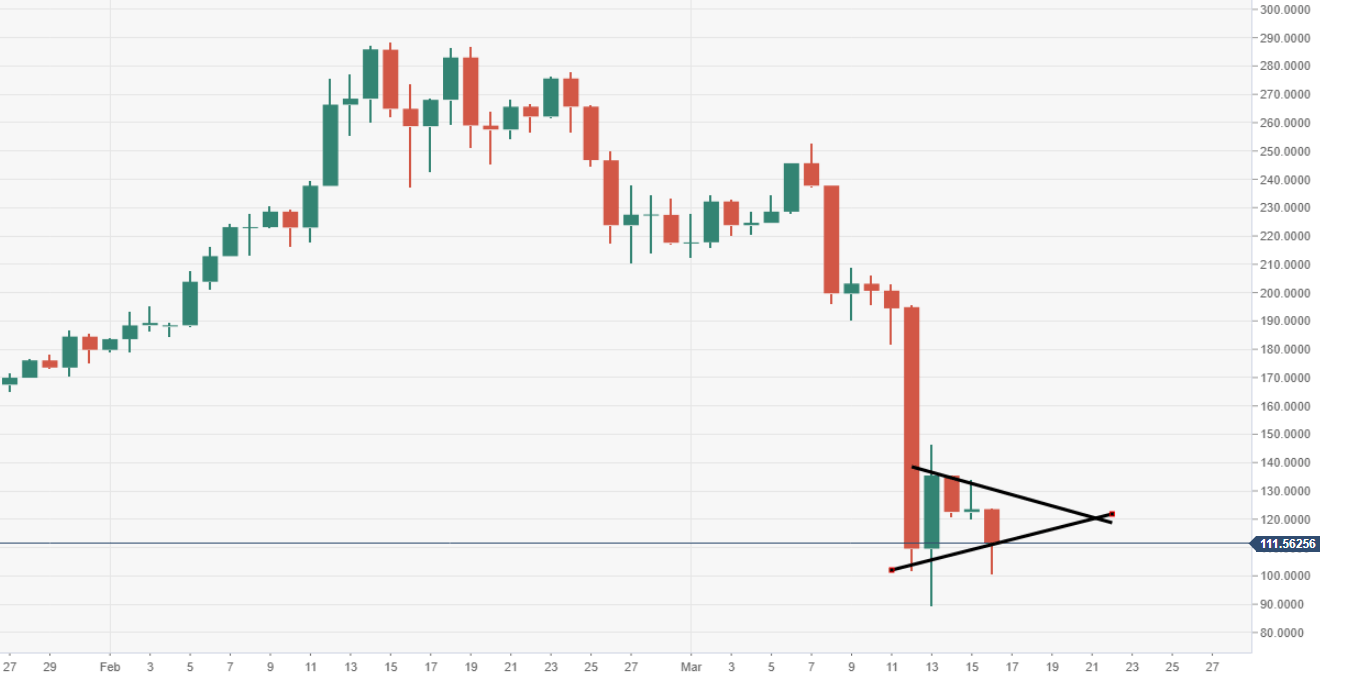
- The price has been narrowing for four sessions, forming a bearish pennant pattern.
ETH/USD daily chart
Price action has formed a bearish pennant via the daily chart view, subject to another wave of downside pressure.
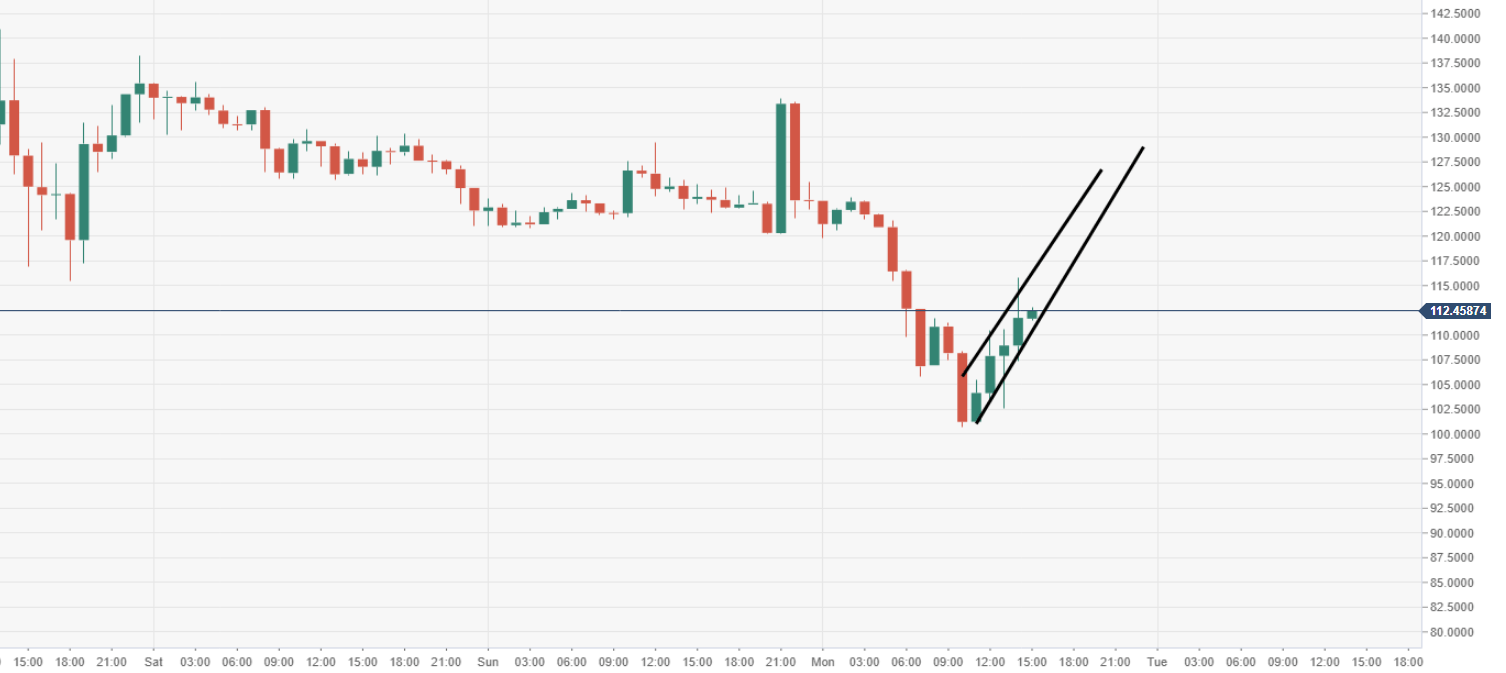
ETH/USD 60-minute chart
Price action rising within a near-term bearish flag structure after the price bounces at sessions lows off $100.
Spot rate: 111.71
Relative change: -9.50%
High: 123.91
Low: 100.72
