- ETH/USD went down from $264.75 to $239.40 this Friday.
- ETH/USD reached a low of $224.
Ethereum had a roller coaster of a Friday as it went down from $264.75 to $237.85, charting a 10% decrease in price. ETH/USD went down from $264.60 to $229.75 within the first 11 hours of the day. Following that, the bulls took the price up to $240 in the next two hours, before the bears re-entered the market and took the price back down to $229.75. The Bulls closed out the day and took ETH/USD up to $239.40.
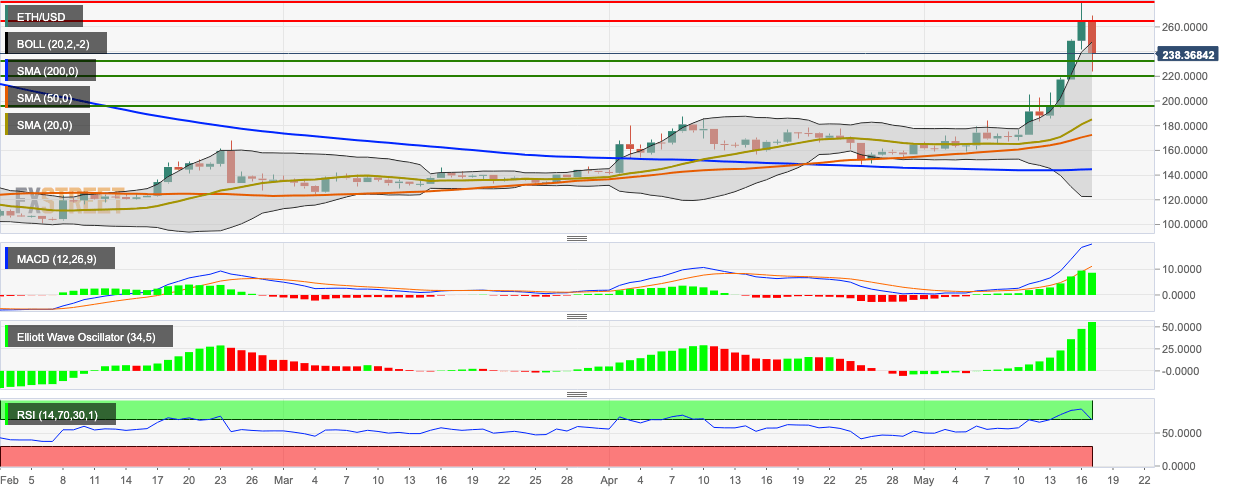
ETH/USD Daily Chart
- The nearest support level on the downside lies at $232.35.
- The latest session took the price back inside the 20-day Bollinger band.
- The price is trending above the SMA 200, SMA 50, and SMA 20 curves.
- The MACD (moving average convergence divergence) indicator shows decreasing bullish momentum.
- The Elliot Oscillator has had 12 consecutive bullish sessions despite the latest bearish price movement.
- The relative strength index (RSI) has taken a turn from 88.89 to 71.40.
