- Ethereum price is trading in the red by 1.70% in the session on Friday.
- ETH/USD price action is very much consolidating following a double top being hit at $288.
- The bears are trying to regather momentum, running at two sessions in the red.
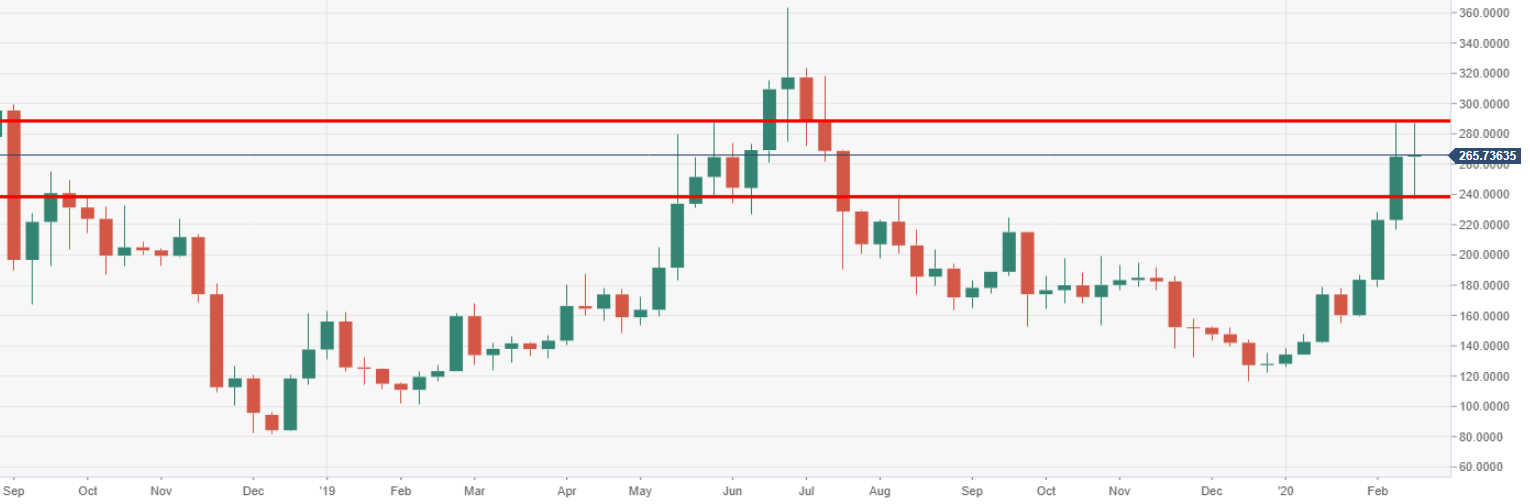
ETH/USD weekly chart
The price is stuck within a key range, $290-240, heading for a potentially negative weekly close, which if being the case could be a signal of a change in trend.
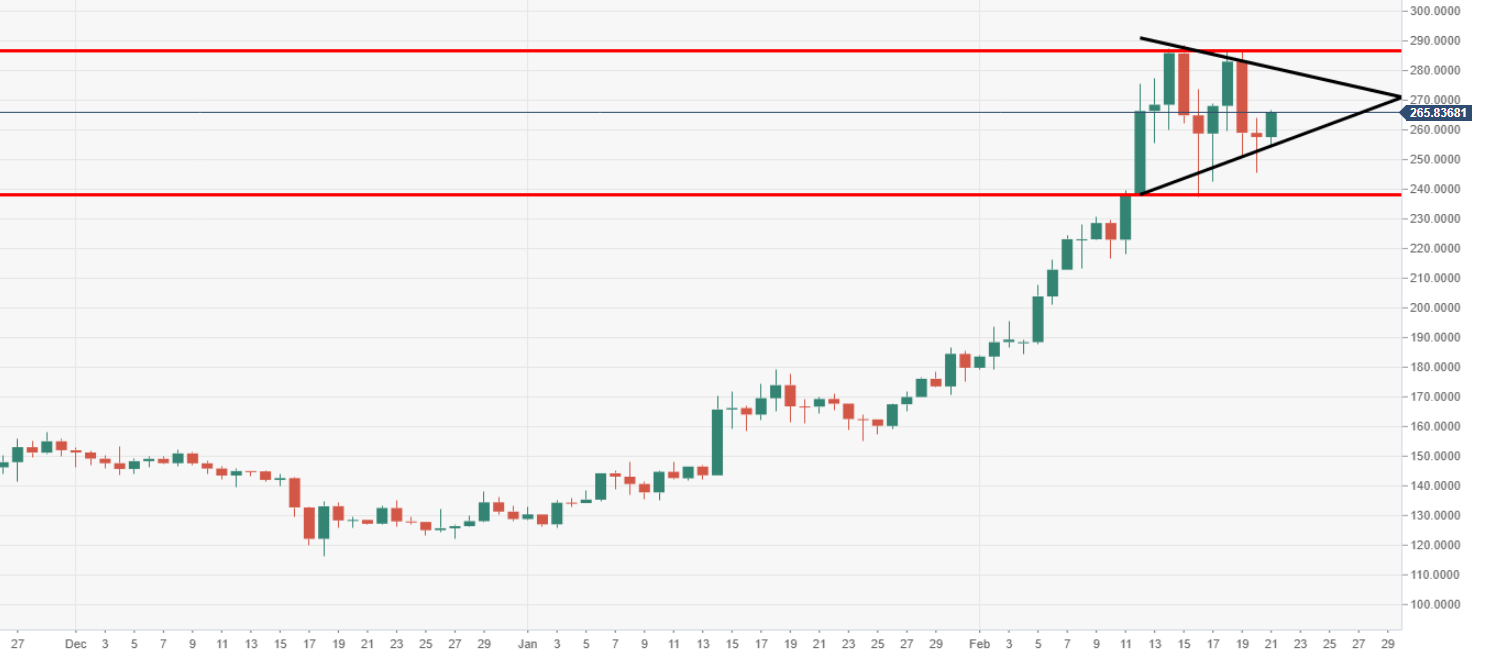
ETH/USD daily chart
The price is narrowing, buying momentum would likely be seen upon a breakout to the upside of the top at $288, to the downside, bearish momentum would likely be seen upon a breakout of the double top formation neckline at $240-38 region.
Spot rate: 265.83
Relative change: +3.15%
High: 266.76
Low: 254.30
