- ETH/USD fell from $132.50 to $128 this Monday.
- The Elliott Oscillator has had four consecutive green sessions.
ETH/USD daily chart
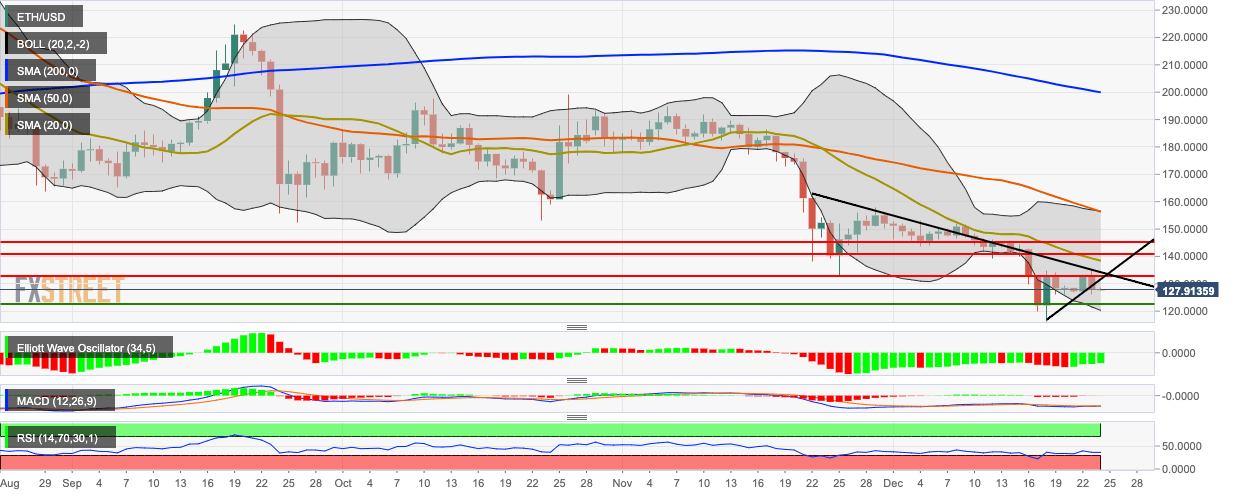
ETH/USD is on course of charting two consecutive bearish days. The price fell from $132.50 to $128 this Monday and has fallen further to $127.80. In the process, Ethereum dropped below the triangle formation. The bulls must overcome resistance at the downward trending line and the 20-day Simple Moving Average (SMA 20) curve. The Elliott Oscillator has had four straight green sessions, while the Moving Average Convergence/Divergence (MACD) indicates decreasing bearish momentum. The Relative Strength Index (RSI) is hovering around 36.36, next to the oversold zone. This could potentially mean that ETH/USD will go down further, before facing a possible bullish correction.
