- The unstoppable bulls ignore oversold levels while focusing on $160.
- The 4-hour chart technical indicators stay in the positive as buyers gain more traction.
Ethereum has become the darling of the cryptocurrency in the last couple of days. The asset opened the trading this week making incredible gains to the upside. Prior to the gains, ETH/USD was in consolidation around $120. In the previous week, bullish momentum failed to break past $130 leading to a retracement.
The gains yesterday saw Ethereum breakthrough several hurdles becoming a market leader. Stepping above $130 ignited more gains above $140. Further gains breached the resistance at $150. However, there has been a correction with ETH retreating to $148.85.
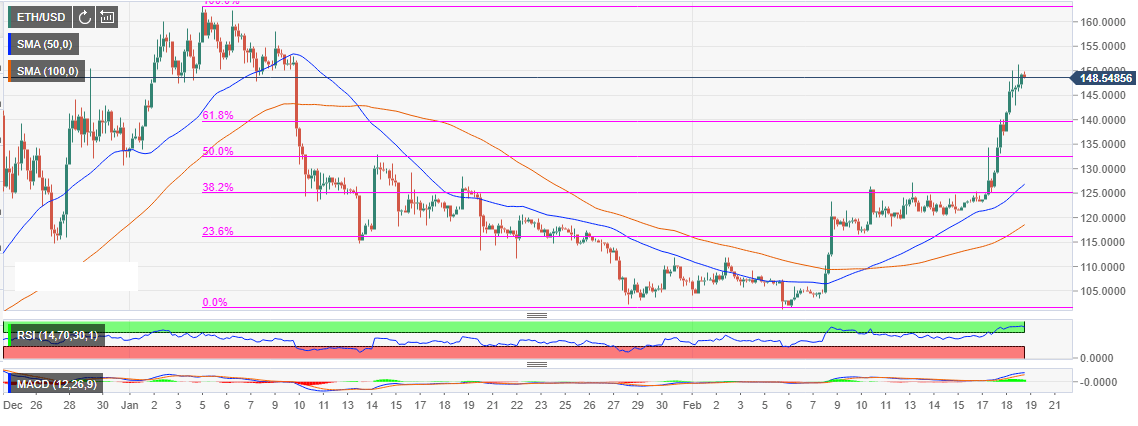
The applied technical indicators show that the cryptocurrency is still on an upward trajectory and it could resume the uptrend above $160. For instance, the Relative Strength Index (RSI) on the 4-hour chart is sustaining its position in the overbought while the Moving Average Convergence Divergence (MACD) has corrected to 2019 high at +8.2. In spite of the oversold levels, Ethereum is likely to make movements towards $160 (medium-term ultimate resistance).
ETH/USD 4-hour chart