- Ethereum price has overcome the 50-day and 200-day SMAs.
- The RSI and MACD accentuate the bullish narrative.
- A movement of the RSI to the overbought zone might trigger sell orders as traders target profits.
The Ethereum price extended the bullish run towards the major resistance level at $2,700. ETH is currently changing hands at $2,331 and rose by 7.64% today. The recent upswing has pushed Ethereum’s market cap by 10.46% to $273,741,754,949.
Ethereum price outlook remains significantly bullish in a strongly bullish crypto market.
If you are interested in trading Ethereum with crypto robots, check out this guide for more details.
Ethereum Hard Fork Underpins ETH’s Bullish Run
In less than 10 days, the Ethereum blockchain is expected to undergo its 11th backward incompatible upgrade which is also referred to as a “hard fork”. The London hard fork contains five Ethereum Improvement Proposals (EIPs) which are expected to improve and optimize the largest altcoin’s market capitalization.
EIP 1559 sis expected to improve transaction speeds and reduce transaction fees on the Ethereum network. As such, EIP 1559 is expected to reduce the volatility of Ethereum transaction fees and make it more profitable. These expected benefits of the improvements on the Ethereum network has provided hind wind that sustains Ethereum price bullish momentum.
Ethereum Price Technical Analysis, can ETH Violate $2,700?
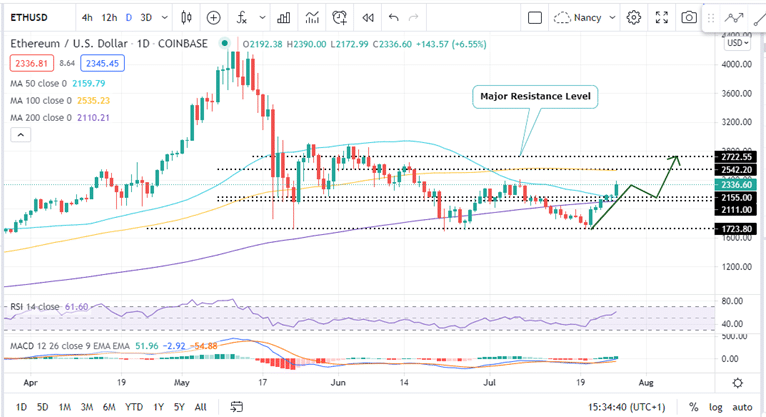
Ethereum price is bullish as it has violated a major resistance at the $2,300 zone. A technical outlook from the daily chart shows that ETH is heading towards the next major resistance level at $2,700.
The Moving Average Convergence Divergence (MACD) indicator remains and its position above the signal line adds credence to the Ethereum’s bullish narrative. Note that once the MACD crosses the zero line into the positive region, ETH is expected to surge even higher.
This bullish narrative is also reinforced by a crypto signal by the Relative Strength Index (RSI) which is currently at 61.7 and is moving towards the overbought region.
On the higher side, a breakout beyond the $2,700 resistance level is likely to trigger more buy orders until the next resistance level is re-tested at $2,890. This level is being extended by a double-bottom pattern on the daily-chart.
Ethereum Price (ETH/USD) Daily Chart
Looking Over The Fence
On the downside, if the RSI moves into the overbought zone, it may signal a profit making ere that triggers selling orders. This will bring more sellers on board and the ensuing selling pressure could invalidate the bullish run.
While a violation of the $2,700 resistance will signal a bullish bias in the Ethereum price, failure to break above this level could trigger a bearish correction invalidating the bullish thesis.
If this happens, a downswing will ensure that will see Ethereum drop to areas below the 50-day SMA at $2,155 and the 200-day SMA at $2,111. A further drop could see Ethereum drop to the July 20 low $1,723 validating a double top bearish pattern.
Looking to buy or trade Ethereum now? Invest at eToro!
Capital at risk
