- Ethereum price is currently contained inside a symmetrical triangle pattern formed on the 30-minutes chart.
- The entire cryptocurrency market aims to bounce back up after wiping more than $90 billion in the past 48 hours.
Ethereum managed to reach a new 2020-high at $623 thanks to the upcoming Eth2 upgrade and the bullishness of the market. Unfortunately, the digital asset suffered a 22% correction down to $481, but it’s trying to bounce back up.
Ethereum price needs to crack this critical resistance level to climb towards $580.
On the 30-minutes chart, ETH has formed a symmetrical triangle pattern and the current price of $515 seems to be favoring the bulls. Ethereum price just climbed above the 50-SMA, turning it into a support level for the first time since November 27.
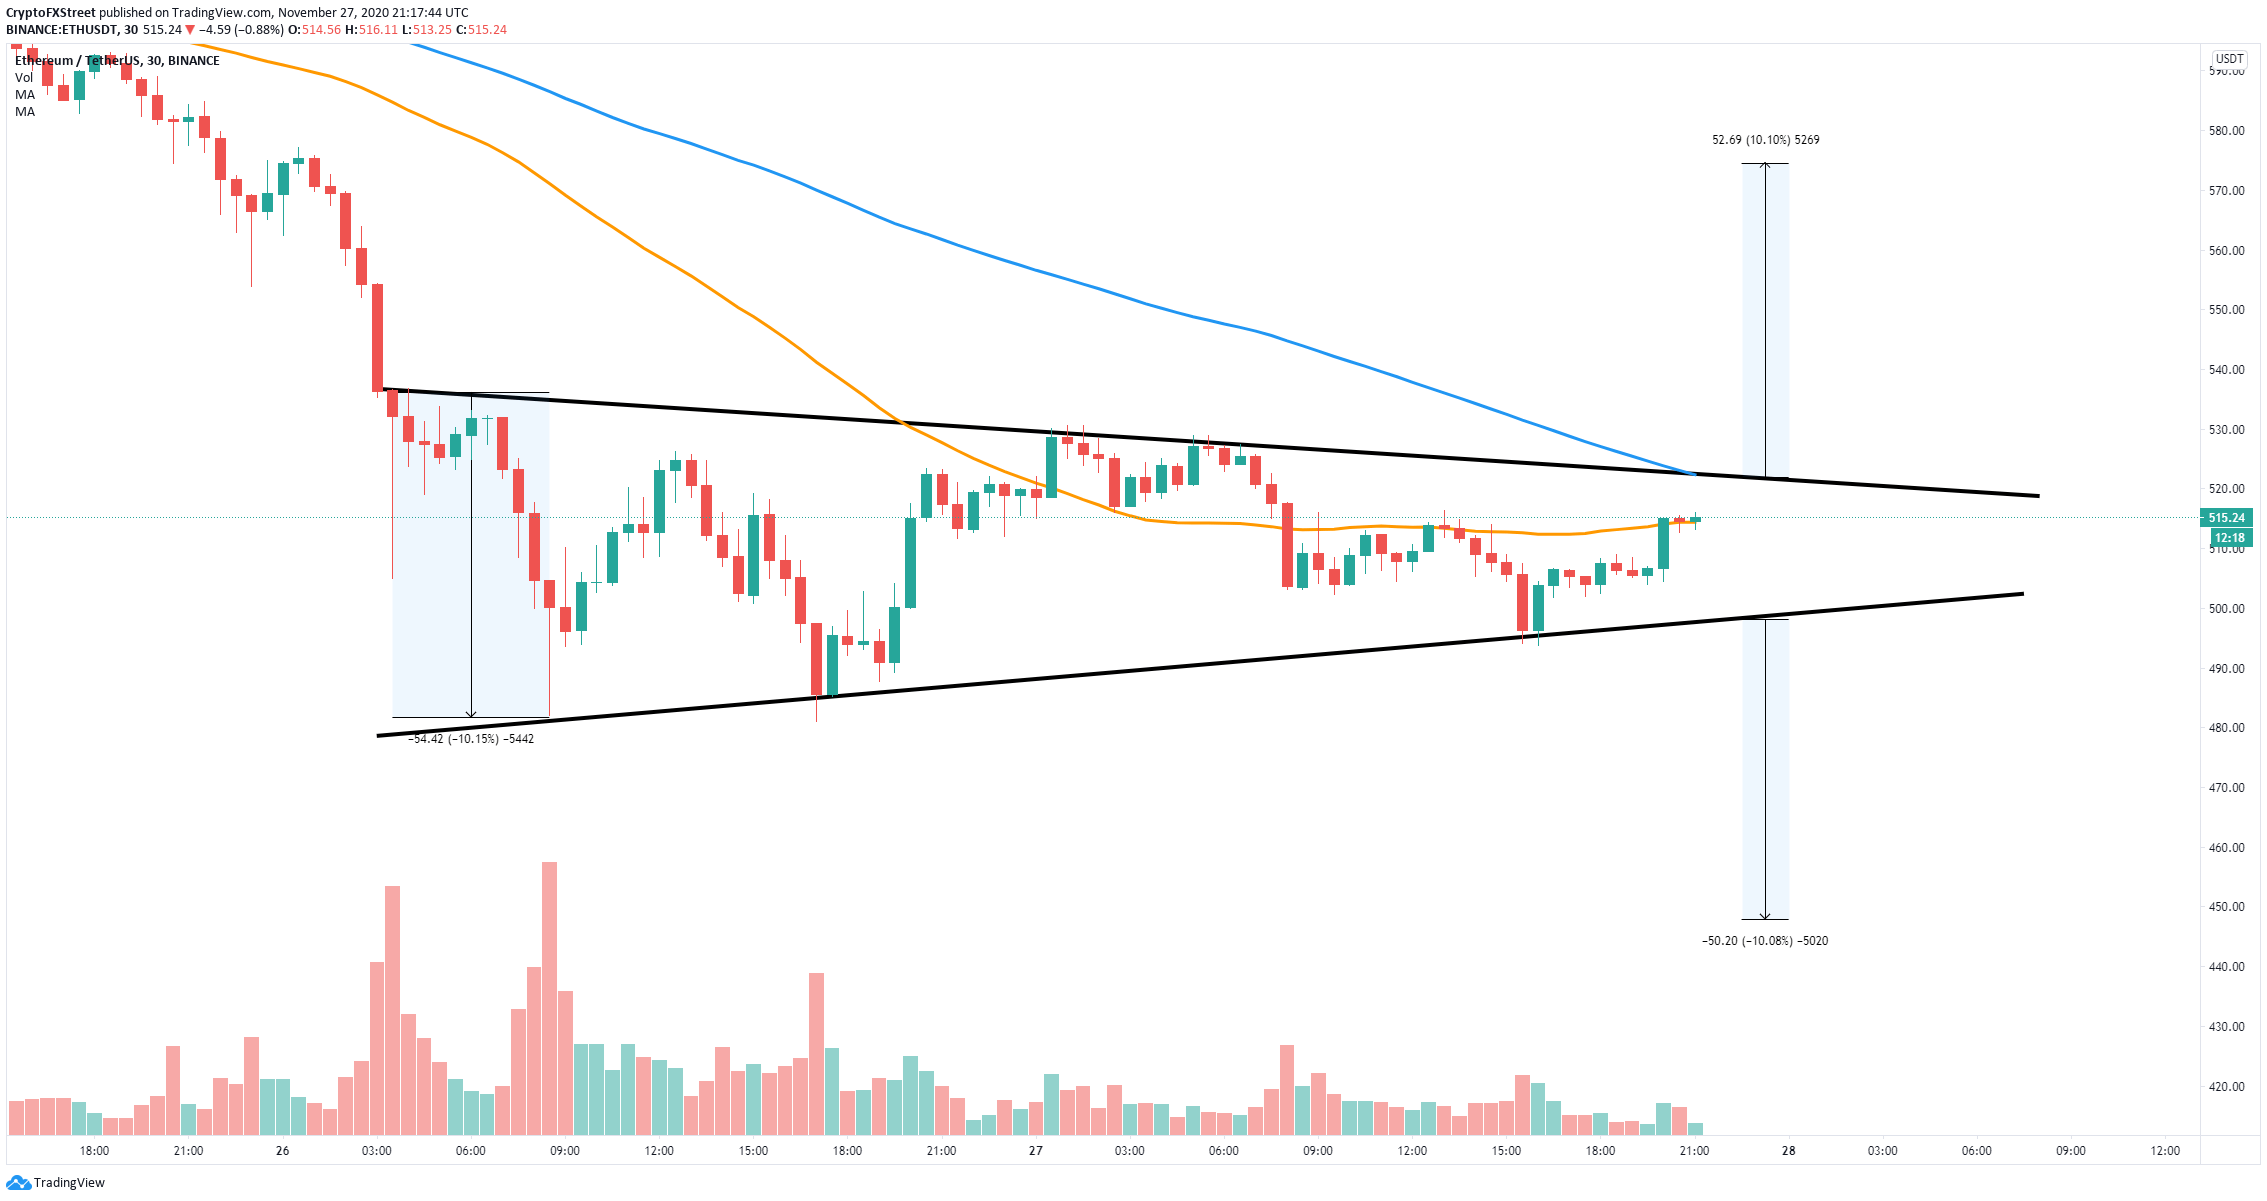
ETH/USD 30-minutes chart
The upper boundary of the pattern at $522 coincides with the 100-SMA which adds more strength to the resistance level. A breakout above that point would quickly drive Ethereum price towards $580 with a 10% move.
On the other hand, if bulls fail to defend the 50-SMA support level, Ethereum price could dip to the lower boundary of the symmetrical triangle pattern at $500, which is also a strong psychological support level. A breakdown below this point would push ETH towards $450.
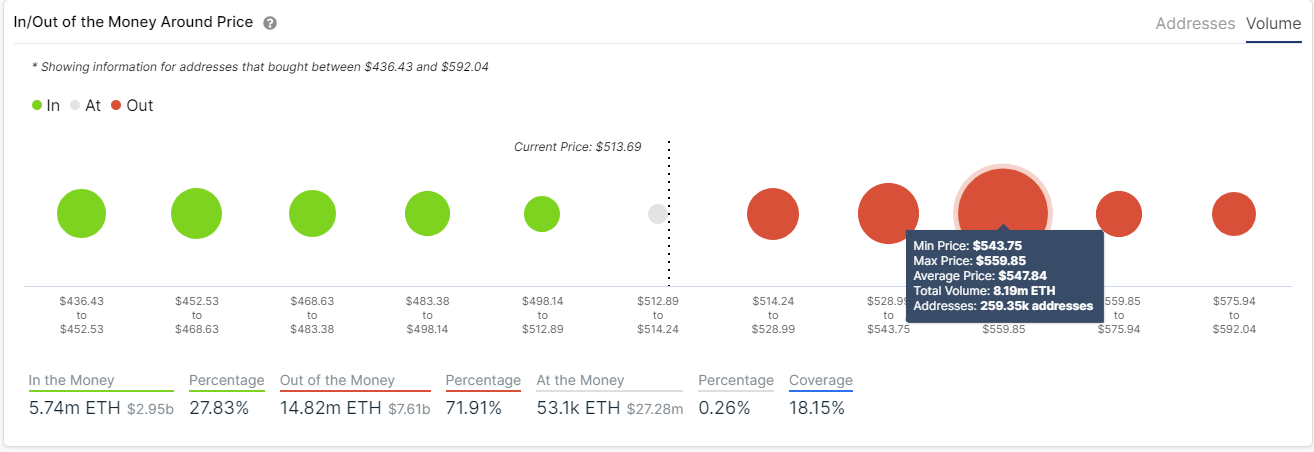
ETH IOMAP chart
The In/Out of the Money Around Price chart shows very little support on the way down without any significant range until $452, which seems to confirm the bearish outlook mentioned above. To the upside, there is a strong resistance area between $543 and $559 which adds some selling pressure to Ethereum.
