- Ethereum trades in the green after rising 2% over the last 24 hours.
- Ethereum price could rally 21% to trade above the $4,000 level.
- IntoTheBlock’s IOMAP model shows that ETH sits on a strong support around the $3,200 zone.
The Ethereum price is consolidating at $3,328 as it continues to trade in a tight range between $3,110 and $3,482 since September 08. The ETH/USD price volatility has been decreasing as it is continuously squeezed from both sides. Crypto market players are waiting to see the direction the Smart contracts token will take in the near future.
Let’s delve into the nitty gritty of the Ethereum price action.
Ethereum Price Could Break Higher For A 21% Rally
The Ethereum price prediction is bullish as it trades in the green around $3,328. A drop below the immediate support at around $3,200 will first face the 50-day Simple Moving Average (SMA) at $3,167. But a look at the ETH/USD daily chart shows that this level is not a big hurdle for sellers given the previous price action. But once below the 50-SMA, the Ethereum price may not drop below the supplier zone between $2,906 and $3,428 marked out in purple.
Therefore, it is not expected that Ethereum will drop beyond this point given a similar price action between August 07 and August 31 saw ETH break out upwards on September 01. This breakout saw Ethereum price rally 19% to record a high of $4,091 on September 05.
ETH/USD Daily Chart
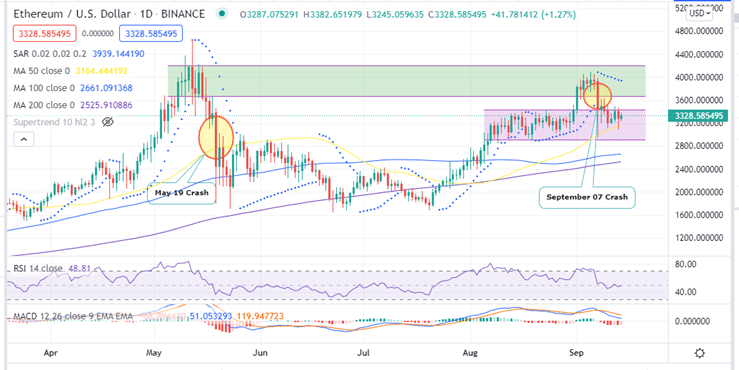
Similarly, a breakout above the supply zone at $3,428 could see the biggest altcoin by market capitalisation rally to test the September 05 high above $4,000. This will represent an almost 21% rise from the current price.
This rise will mark the entry of the ETH into the demand zone (marked in green) that previously saw Ethereum reach its all-time high in May.
However, during bullish breakout, Ethereum must fill the gap created by the September 07 flash crash. Note that a similar crash happened on May 19 causing the asset to fall below the demand zone. Ethereum eventually filled out this gap before trading again with this range as witnessed recently between September 01 and September 07.
The filling of this gap does not have to happen immediately and it might take some time as it did following the May 19 crash. Perhaps good news for those holding on to their ETH?
Ethereum Price Sits On Strong Support Around $3,200
ETH price bullish narrative is accentuated by a number of technical factors. For example, the upsloping moving averages show that the market momentum is still bullish. In addition, the upward movement of the Relative Strength (RSI) Indicator is an indication that the bulls are currently controlling the Ethereum market.
Moreover, the position of the Moving Average Convergence Divergence (MACD) indicator in the positive region above the zero line shows that ETH/USD price market momentum remains bullish. On the four-hour time frame, the MACD has just sent a bullish crypto signal. This happened earlier to day when the MACD line (blue) crossed below the signal line (orange) indicating that Ethereum might remain bullish in the near term.
Furthermore, the daily chart shows that the Ethereum price sits on strong support provided by the 50-day SMA at $3,167, the 100-day SMA at $2,671 and the 200-day SMA at $5,528. This is accentuated by on-chain metrics from the In/Out of the Money Around Price (IOMAP) model by IntoTheBlock which shows that Ethereum has robust support downwards.
For example, the immediate support around $3,200 is within the $3,205 and $3,303 price range where approximately $2.21 million ETH were previously bought by roughly $1.31 addresses. This support is robust enough to absorb any selling pressure that might ensure.
Ethereum IOMAP Chart
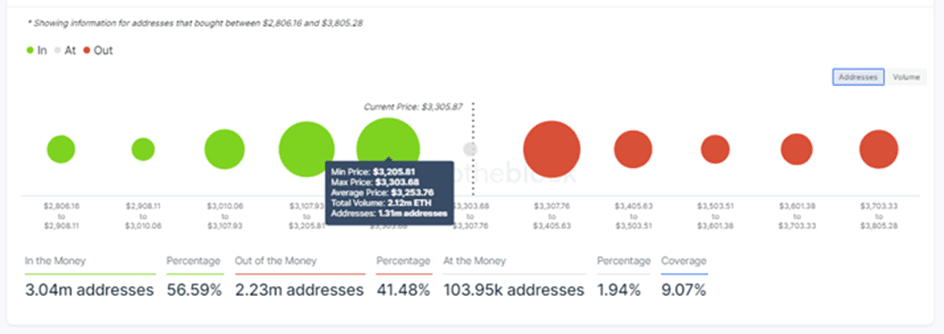
Therefore, if Ethereum bulls are able to overcome the immediate resistance around $3,433, the journey upwards towards $4,000 will be met by relatively weak resistance as shown by the IOMAP chart above. Therefore, trading above the all-time high around $4,650 becomes a possibility.
If things go awry for ETH bulls and sellers manage to pull the Ethereum price below the supply zone at $2,906, the asset will fall further to re-visit the $2,671 support wall embraced by the 100-day SMA. A further drop downwards would see ETH drop to the 200-day SMA at $2,528, a 24% drop from the current price.
Where to Buy ETH
If you want to trade Ethereum this week, you can do so on the following crypto trading platforms:
- eToro
eToro is one of the trusted exchange platforms in the crypto space. eToro supports copy trading, which allows new traders to learn from market experts. eToro also charges low trading fees and commissions. - Binance
The other platform where you can buy COMP is Binance. Binance is one of the largest exchange platforms. It supports a wide range of cryptocurrencies and trading pairs. It also offers user-friendly features.
Looking to buy or trade Ethereum now? Invest at eToro!
Capital at risk
