- ETH/USD went up from $283.50 to $285.20 this Friday.
- Despite the bullish comeback, the market momentum remains bearish.
ETH/USD daily chart
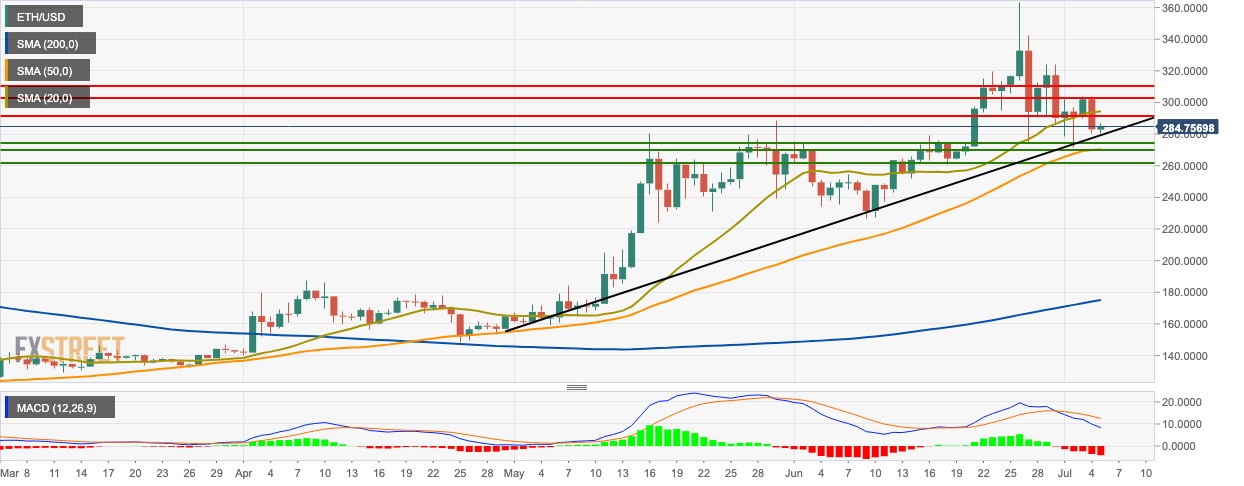
This Thursday was pretty bearish for ETH/USD as the price fell from $302.20 to $283.50. The bulls are attempting a comeback and have taken the price back up to $285.20. This Thursday, the price fell below the 20-day simple moving average (SMA 20) curve, but it is still above the SMA 50 and SMA 200 curves. The moving average convergence/divergence (MACD) indicator shows five straight bearish sessions of increasing intensity.
ETH/USD 4-hour chart
-636978921258537267.png)
The 4-hour ETH/USD market was trending in the green Ichimoku cloud before it plunged. The market found support on the $283.45 line. The Elliot Oscillator has had three bearish sessions in a row.
ETH/USD hourly chart
-636978920643521216.png)
The hourly price chart is trending in an upwards channel formation. The price fell below the lower curve of the 20-day Bollinger band before it managed to creep back in. The widening of the Bollinger jaw indicated increasing market volatility. The relative strength index (RSI) indicator is in the oversold zone before it crept out.
Key Levels
