ETH/USD Daily Chart
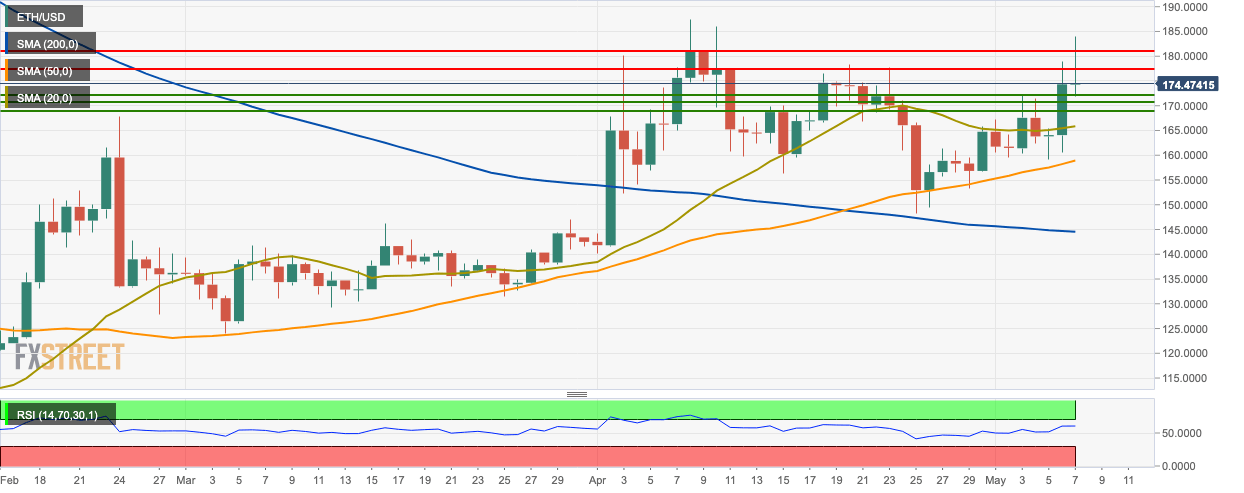
- Ethereum bulls and bears have fought each other to a standstill this Tuesday.
- ETH/USD is currently trading for $174.50 after reaching a high of $184.
- The bulls are aiming for the $180-level as the bears are fighting furiously to keep the price down.
- The market is trending above the SMA 200, SMA 50, and SMA 20 curves.
- The relative strength index (RSI) indicator is currently trending at 62.50.
ETH/USD 4-Hour Chart
-636928699462886050.png)
- The 4-hour ETH/USD market has taken the price below the upper curve of the 20-day Bollinger band.
- The lower band of the Bollinger band has crept up which shows lower market volatility.
- The Elliot wave oscillator shows three consecutive bearish sessions following seven consecutive bullish sessions.
- The market is trending above the SMA 200, SMA 50, and SMA 20 curves.
- The SMA 50 curve may cross over the SMA 200 curve which is a bullish sign.
ETH/USD Hourly Chart
-636928699038687291.png)
- The hourly ETH/USD price has had a bearish breakout from the flag formation.
- The bulls then came back and brought the price back up to $176
- The Ichimoku indicator shows upcoming bearish market momentum.
- The signal line is converging slowly with the MACD line indicating decreasing bullish momentum.
Key Levels
