- Ethereum price is trading in the red marginally, down 2.50% the session on Tuesday.
- ETH/USD is moving within consolidation mode within a bearish flag structure.
- Heavy supply can be observed at the $200 price market, where the price faced some rejection just a few sessions ago.
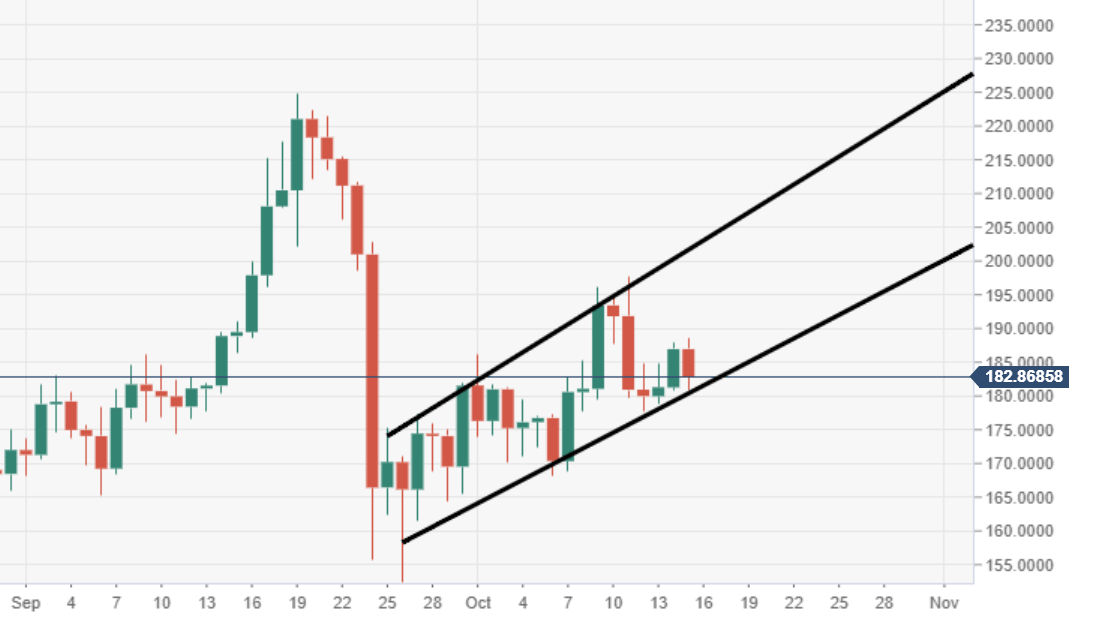
ETH/USD daily chart
Price action is moving within a bearish flag structure, subject to a potential breakout south.
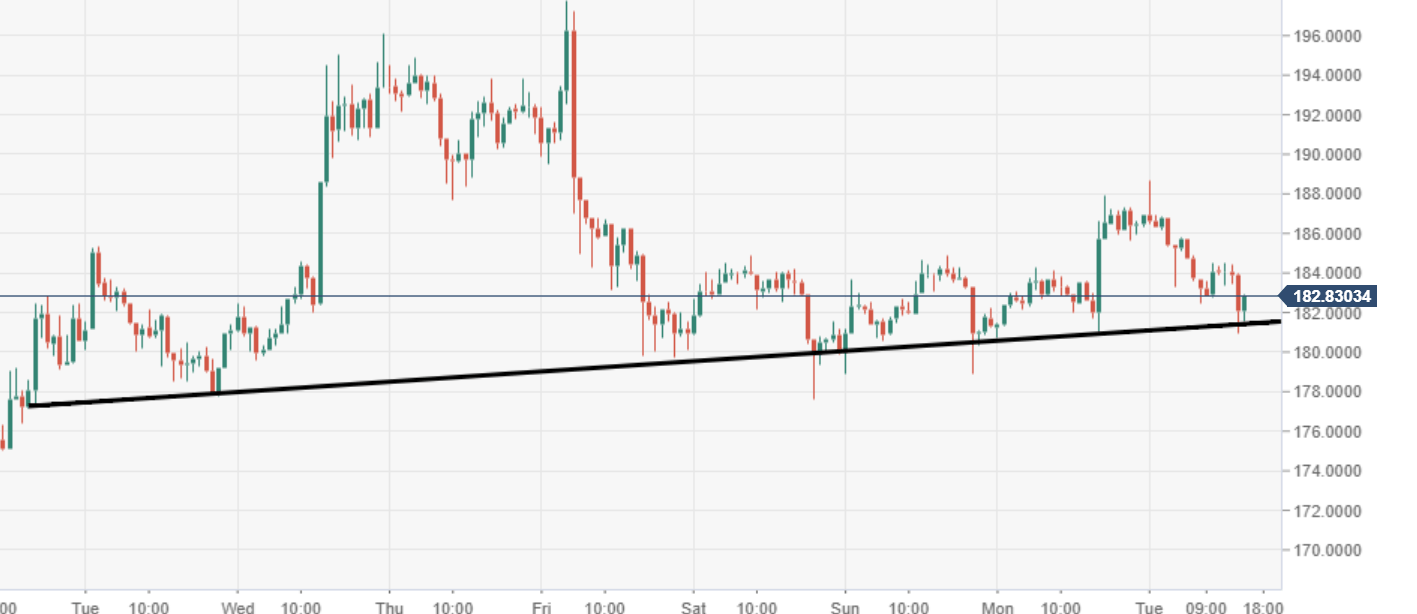
ETH/USD 60-minute chart
Price action is being supported by an ascending trend line near-term via the 60-minute chart view, bears are testing it to the downside.
Spot rate: 186.07
Relative change: -2.50%
High: 188.68
Low: 180.90
