- Ethereum price on the back foot once again on Tuesday, nursing steep losses of 4%.
- ETH/USD bounced around a double bottom pattern formation, testing the $100 level to the downside, but buyers protecting.
- $100 is heavily under threat, which could open the flood gates to a new wave of selling.
ETH/USD 4-hour chart
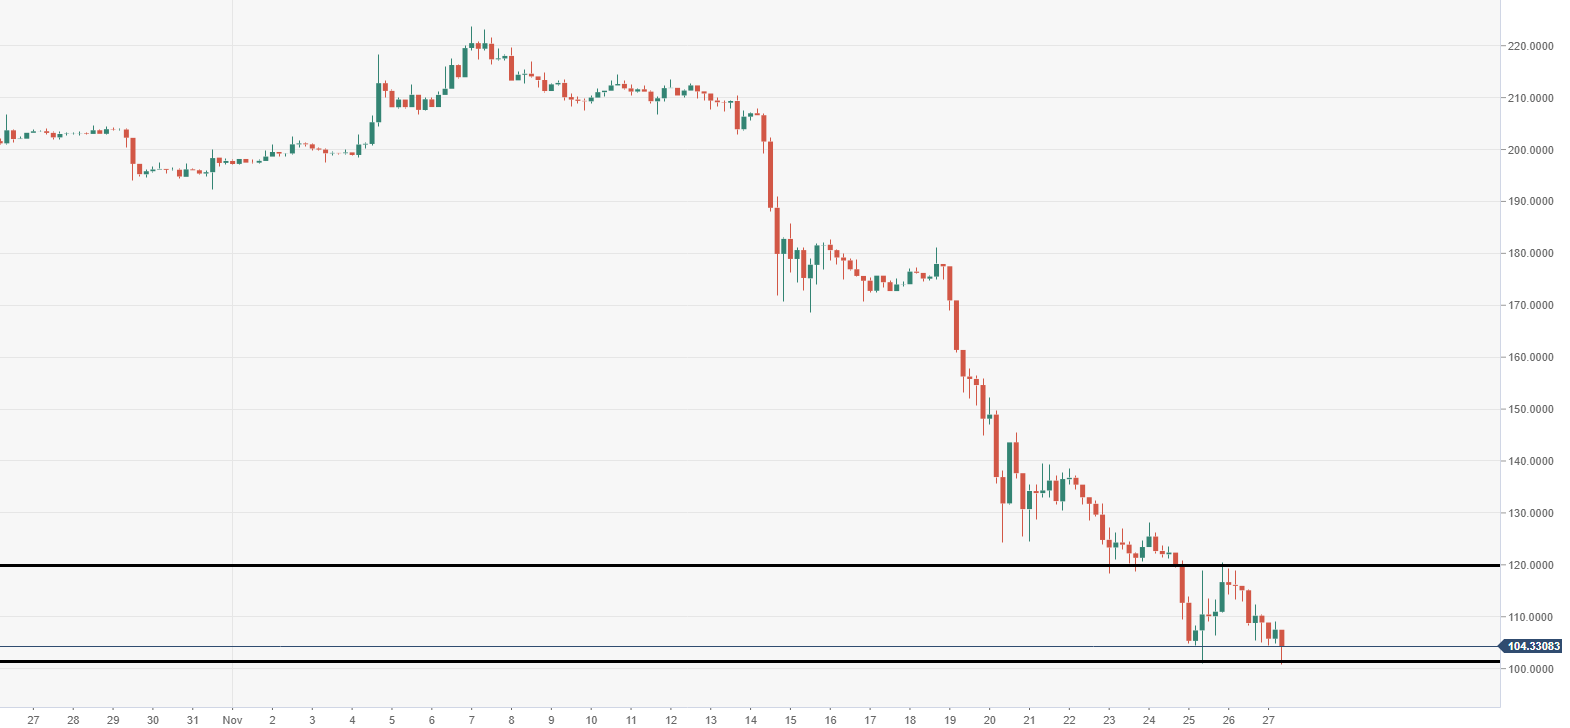
Spot rate: 104.49
Relative change: -4.37%
High: 108.94
Low: 101.06
Trend: Bearish
Support 1: 101.06, double bottom.
Support 2: 96.71, daily pivot point support.
Support 3: 88.48, daily pivot point support.
Resistance 1: 117.12, breached trend line.
Resistance 2: 119.61, neckline of double bottom.
Resistance 3: 125.36, daily pivot point resistance.
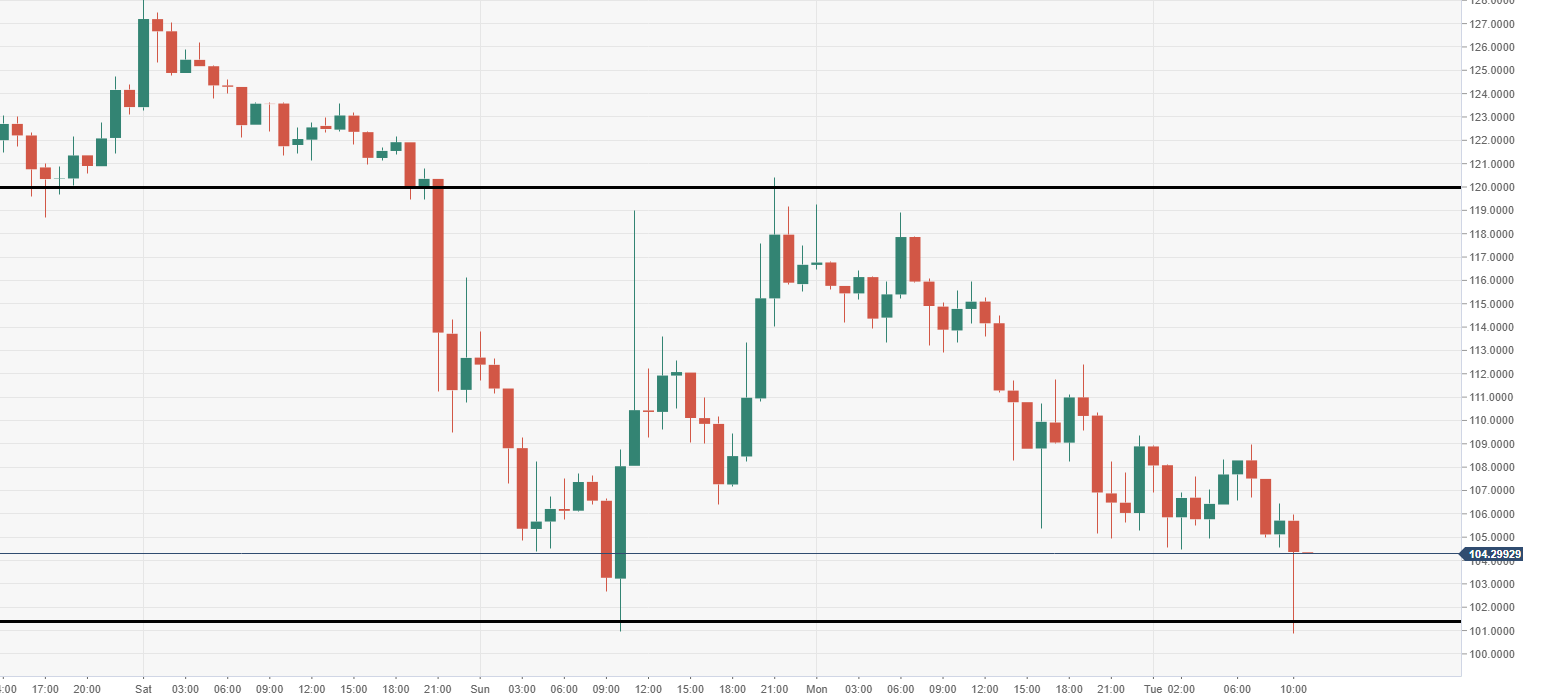
ETH/USD 60-minute chart
- Bears are testing that bottom area to the downside, which could see the flood gates open below the $100 mark.