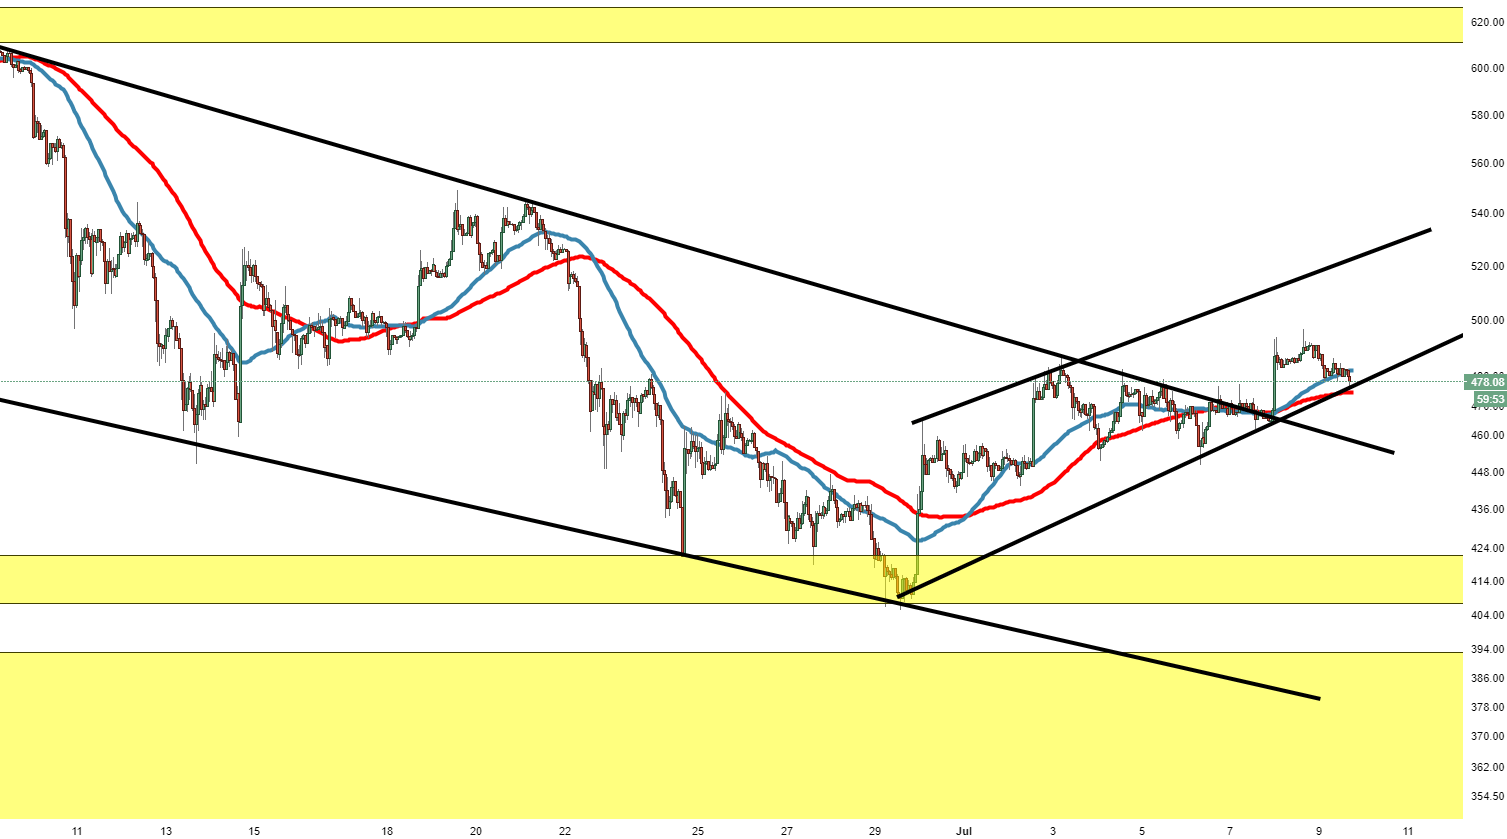
- Ethereum managed to escape a descending channel, however the price failed to gain ground above and beyond the $500 mark.
- ETH/USD is now moving within a rising wedge, which could be subject to a breach from the market bears, with the lower supporting trend line being tested.
ETH/USD 60-minute chart
Spot rate: 0.47752
Relative change: -0.25%
High: 0.48090
Low: 0.47320
Trend: Neutral
Support 1: 475.00, today’s (Monday) low & lower trend line of rising wedge.
Support 2: 473.24, 100MA.
Support 3: 458.09, on top of the broken descending wegde.
Resistance 1: 481.87, 50MA.
Resistance 2: 493.50, (resistance on 60-minute chart).
Resistance 3: 500.00, psychological resistance.
