-
Ethereum price is trading in the red, down marginally 0.20% in the second half of the session.
-
ETH/USD is attempting to stabilize after the brutal selling through the psychological $200 mark.
-
The price managed to end a five consecutive session losing streak.
ETH/USD daily chart
- The price remains supported by a critical demand zone $190-165 range.

ETH/USD 30-minute chart
- Price action via the 30-minute view is moving within a bearish flag structure, subject to a breach.
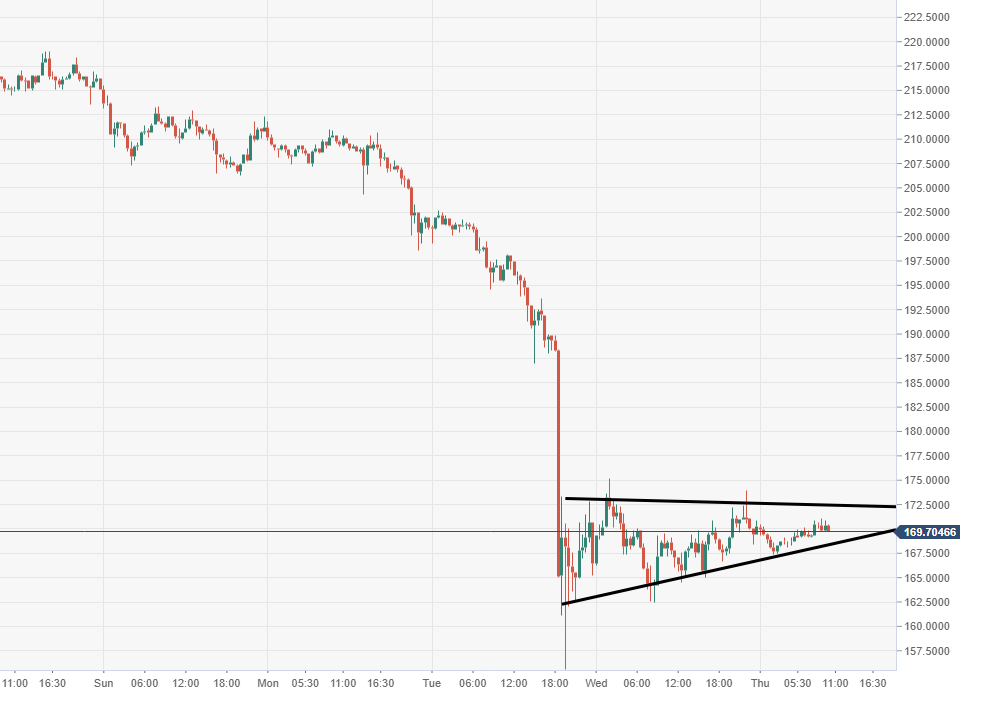
Spot rate: 169.91
Relative change: -0.20%
High: 171.08
Low: 167.37
.
