- Ethereum is trading in the red, nursing losses of some 0.25% in the second part of Monday.
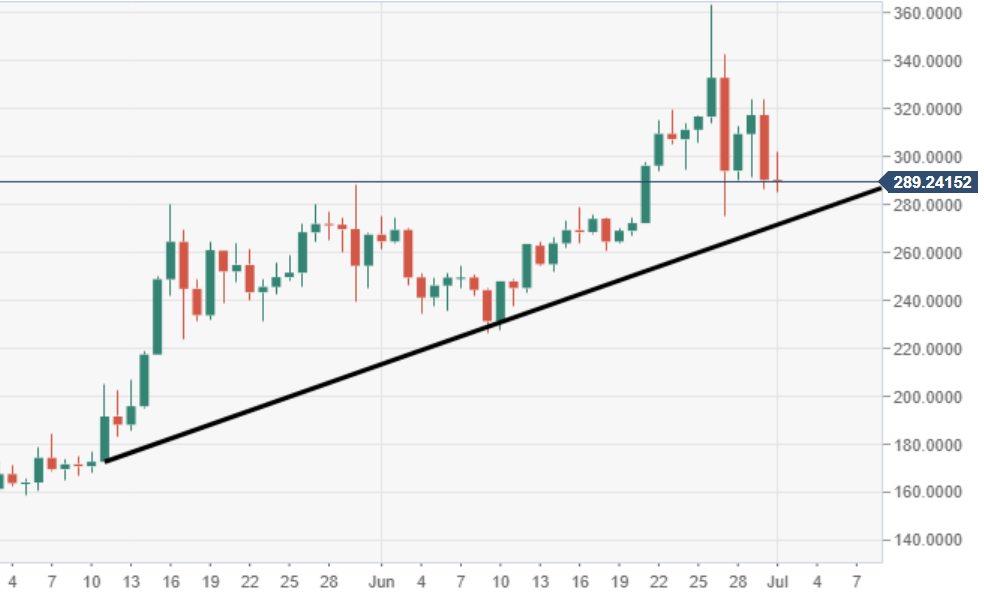
- ETH/USD price action is heading towards a big test of a daily ascending trend line of support.
- A failure of the above holding could invite a chunky bout of selling pressure.
Spot rate: 423.98
Relative change: +3.10%
High: 301.69
Low: 285.04
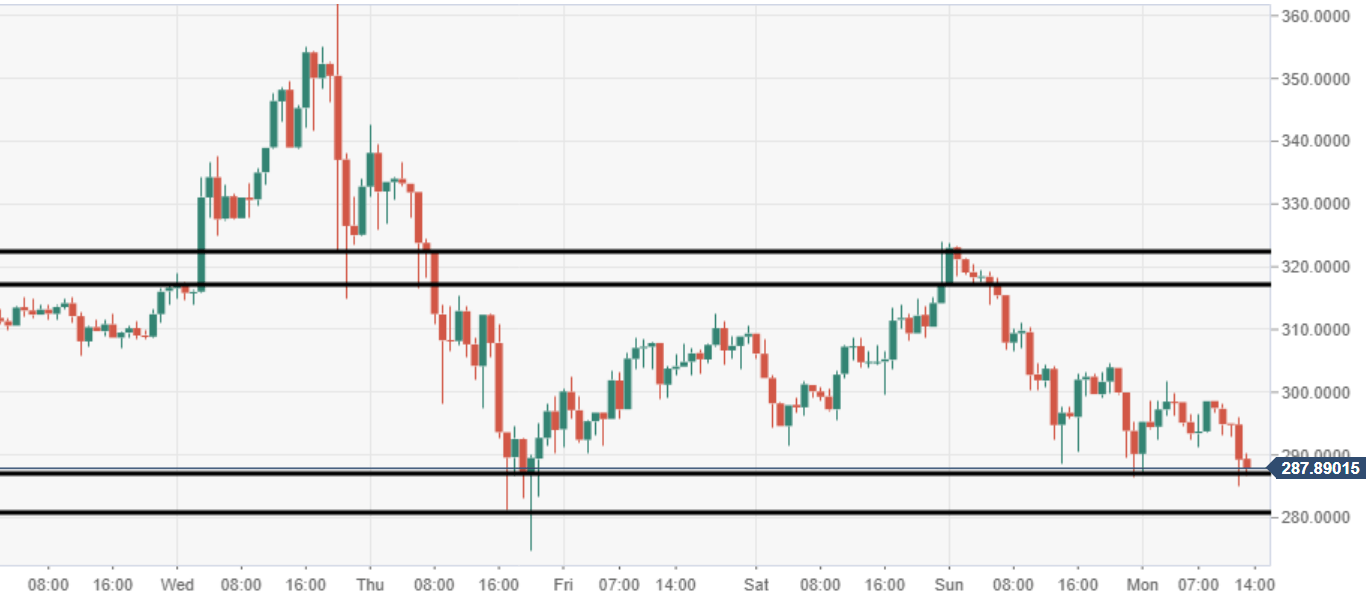
ETH/USD 60-minute chart
- A critical near-term zone can be seen via the 60-minute chart view, keeping prices propped up.
ETH/USD daily chart
- Bears are pressing for a big test of a long-running ascending trend line of support.