- Ethereum price is trading in the red by some 0.35% in the session on Friday.
- ETH/USD price action is running at four consecutive days in the green, as the bulls look to regain control.
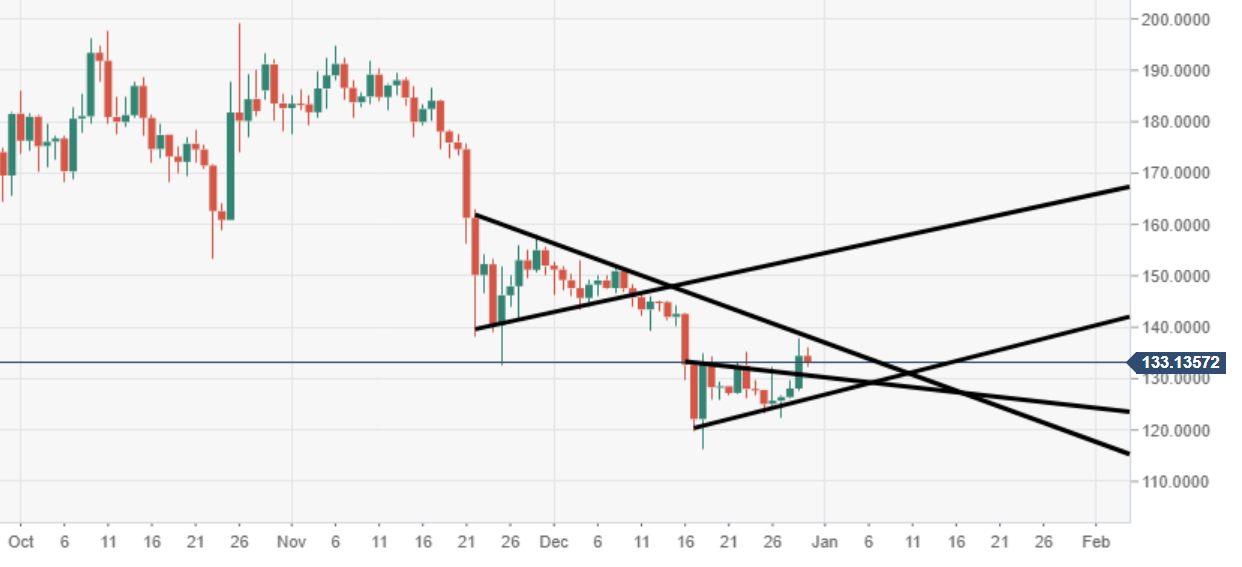
- A big barrier of resistance can be observed at the $140 price mark.
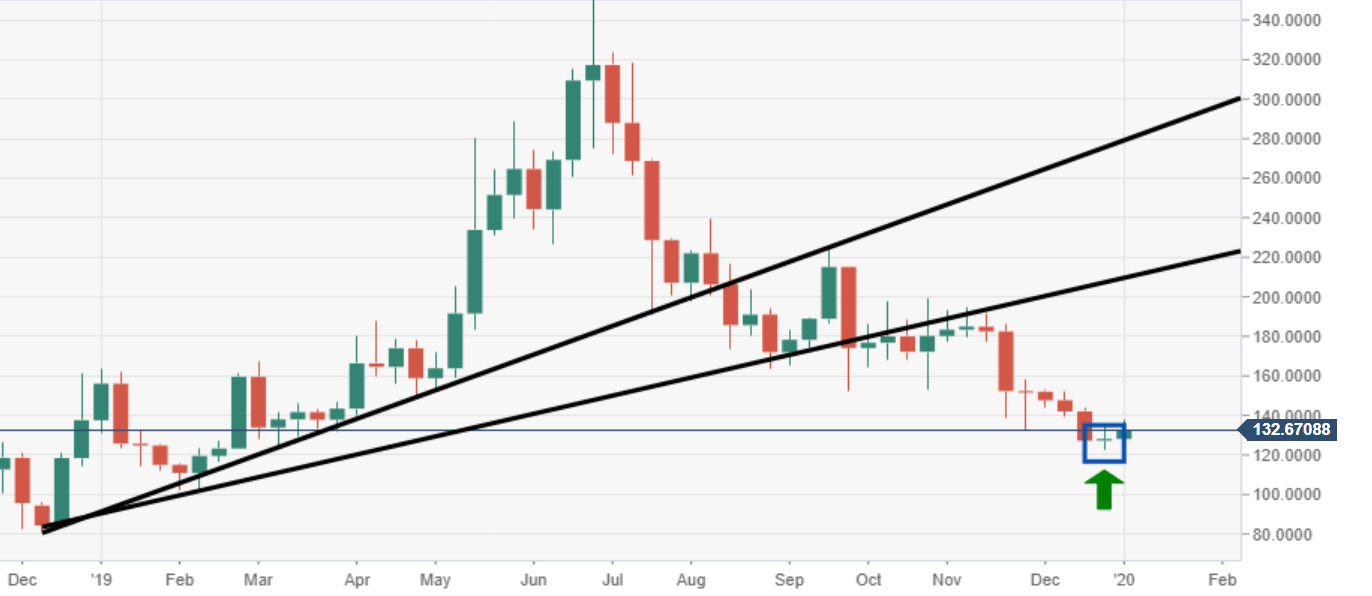
ETH/USD weekly chart
ETH/USD managed to snap a weekly run of losses, the closure last week was in the green, after six consecutive in the red.
ETH/USD daily chart
The bulls push for a step in the right direction, after managing to escape from a bearish pennant structure via the daily.
Spot rate: 124.75
Relative change: -0.40%
High: 136.06
Low: 131.64
