- Ethereum price is seen down over 2% on Monday, inline with the cooling in pricing across the board.
- ETH/USD has been stuck within the $400 territory for over 12 days now, range-bound.
- Looking at the RSI, the price is now oversold, having now entered a demand zone, small buying may be seen.
ETH/USD 30-minute chart
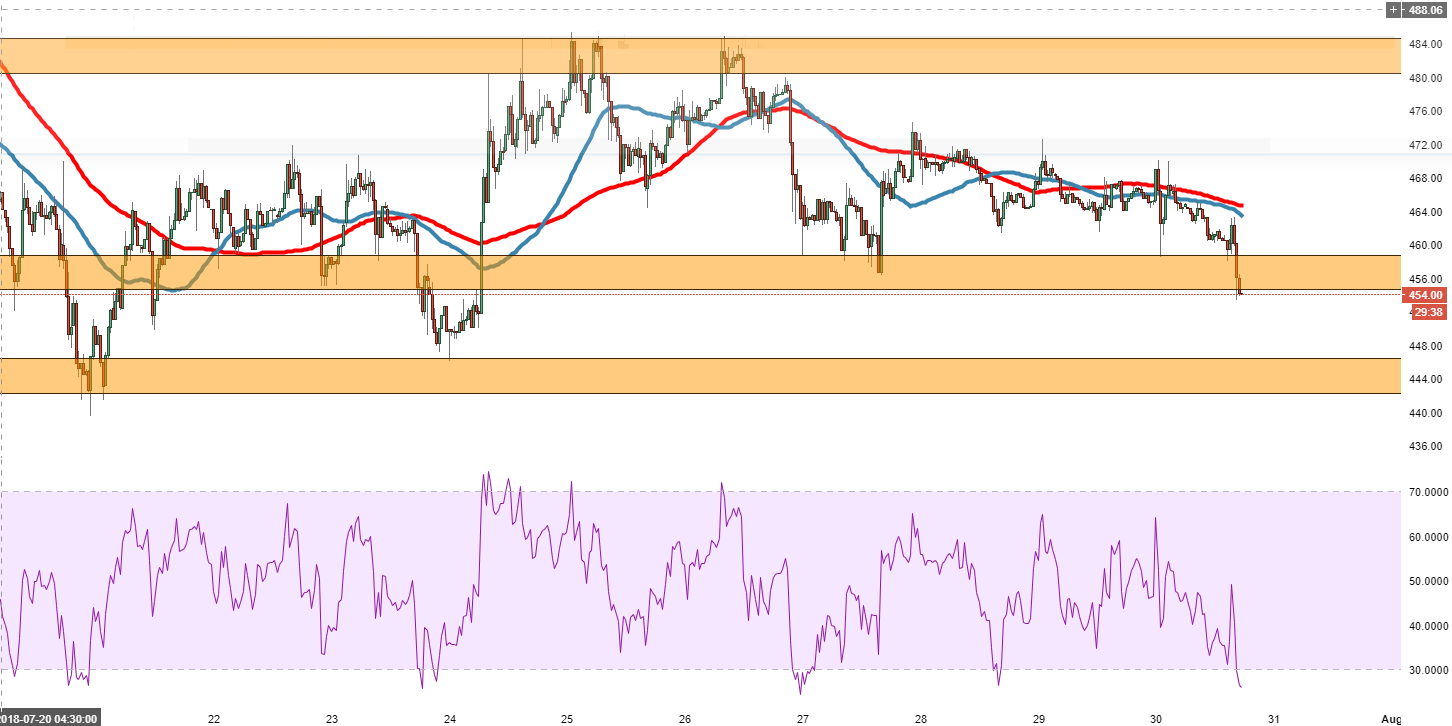
Spot rate: 455.98
Relative change: -2.26%
High: 469.93
Low: 453.34
Trend: Neutral/Bearish
Support 1: 456-455.00, demand zone.
Support 2: 446.00, 24th July low & (support on 30-minute chart).
Support 3: 445.50, demand zone.
Resistance 1: 463.47, 50MA.
Resistance 2: 464.90, 100MA.
Resistance 3: 470.00, (resistance on 30-minute chart).
