Home Ethereum Technical Analysis: ETH/USD set for further failure as price just can’t break free from deadly descending wedge
Crypto News

Ethereum Technical Analysis: ETH/USD set for further failure as price just can’t break free from deadly descending wedge

  • Ethereum price was seen trading ever so marginally within the green, as it continues to lack progression in moving to the north.
  • ETH/USD has again been rejected by the upper descending trend line of the falling wedge pattern.


ETH/USD 60-minute chart
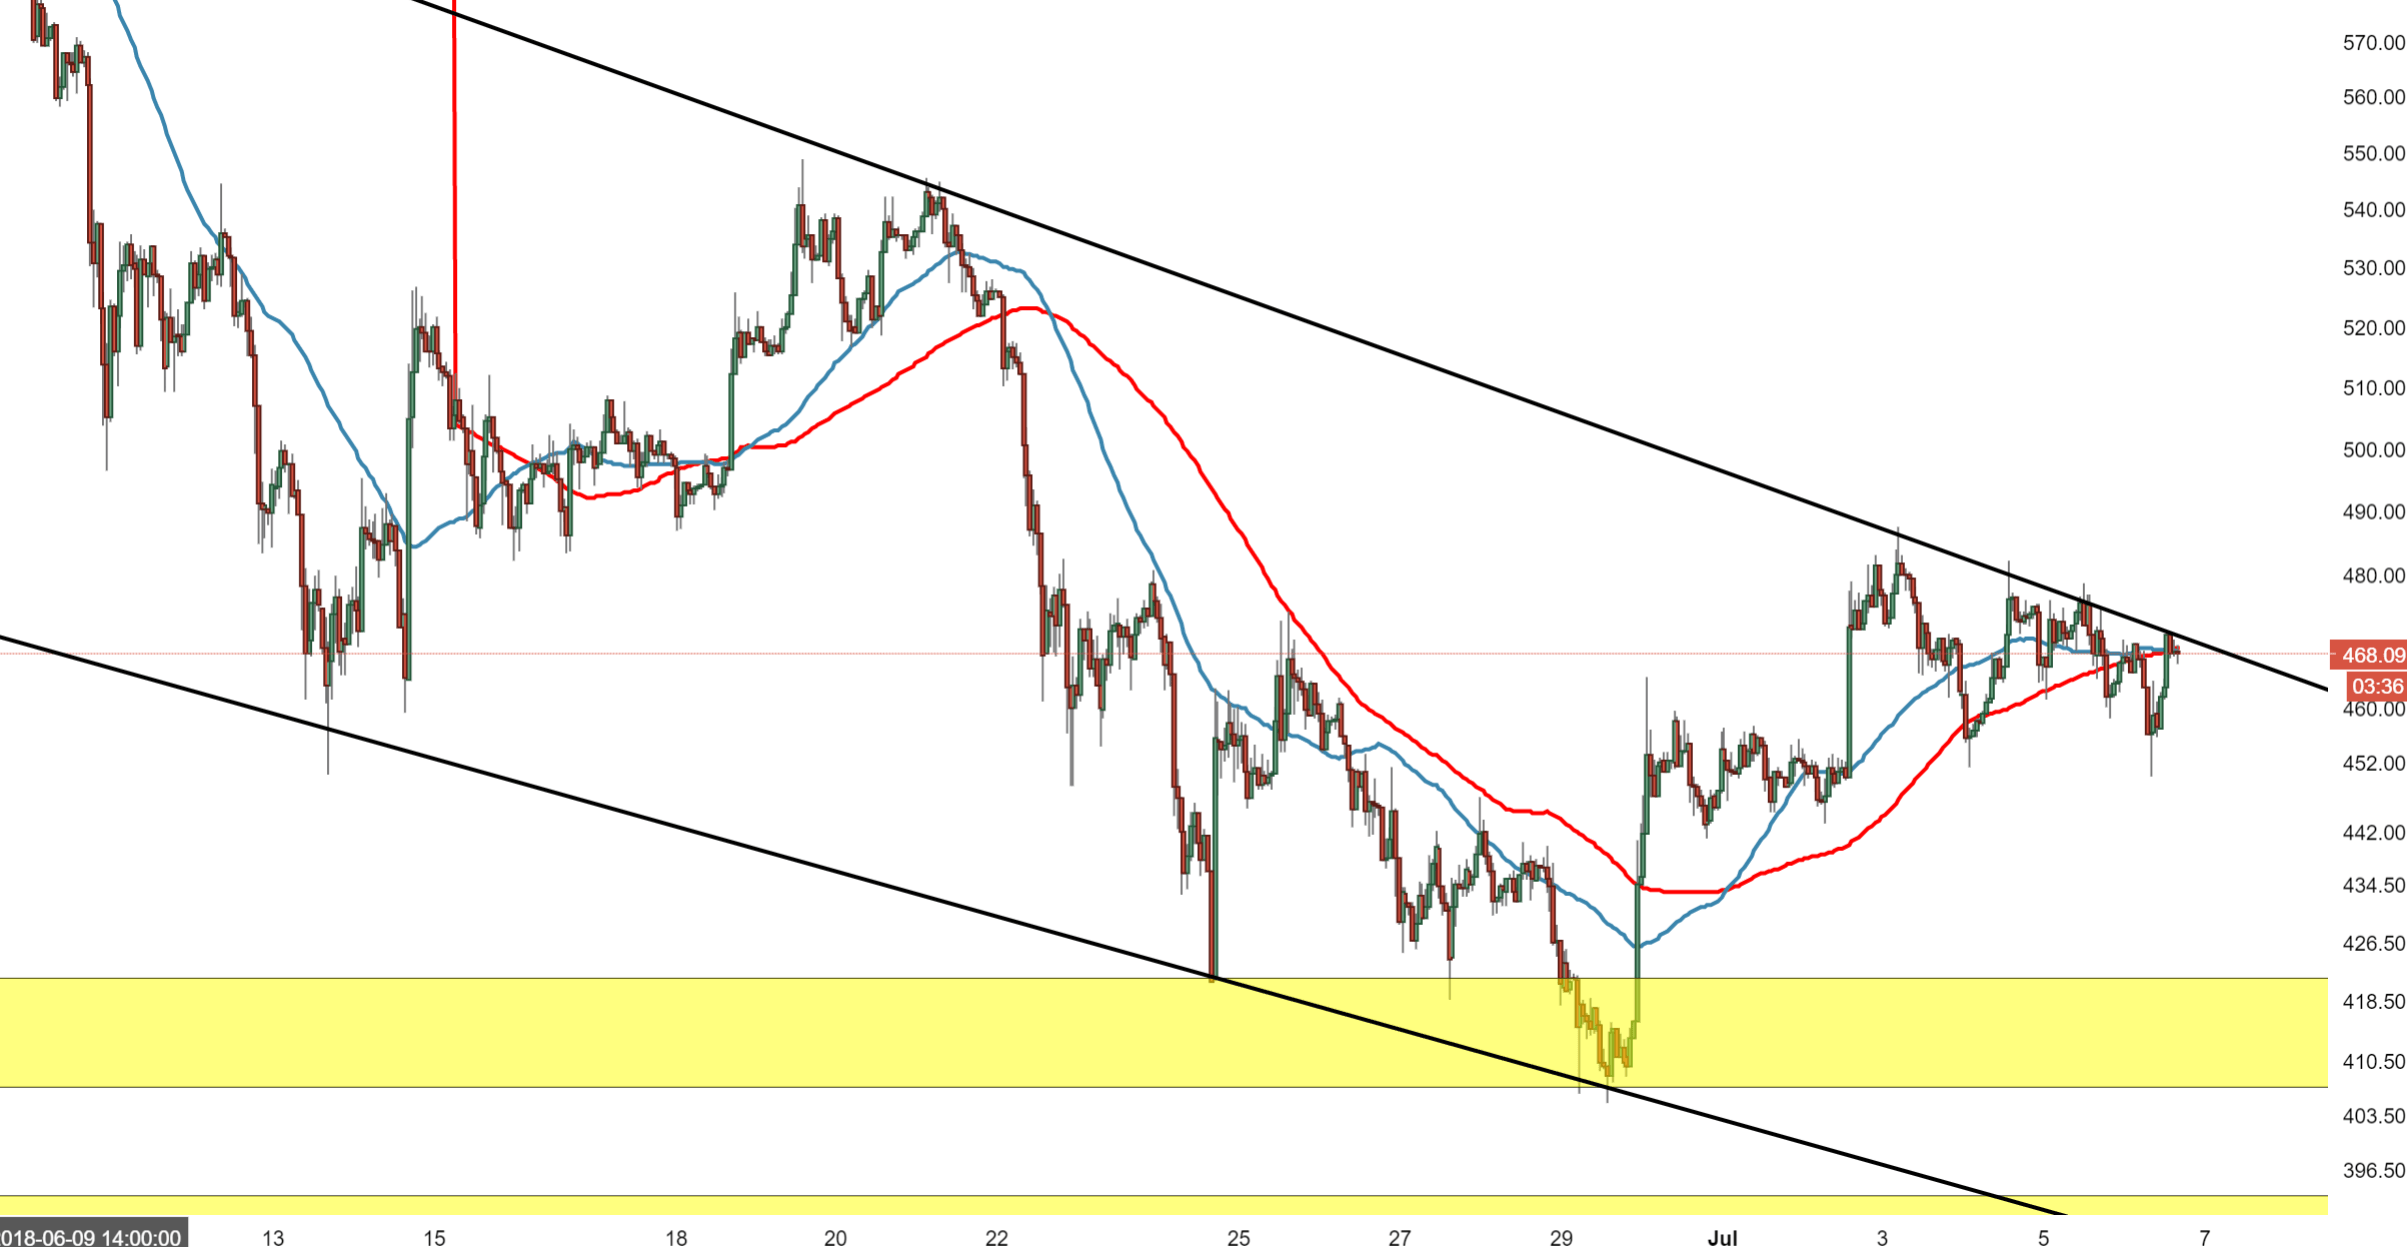


Spot rate:                                    468.09

Relative change:               +0.12%

High:                            470.83

Low:                                                      449.77


Trend:                                                 Neutral


Support 1:                                  464.00, (support on 60-minute chart).

Support 2:                                    440.86, 30th June low.

Support 3:                                    421.50, demand zone.  

Resistance  1:                          469.15, 50MA &100MA.

Resistance 2:                          471.00, upper descending trend line of wedge.

Resistance 3:                          477.50, (resistance on 60-minute).


FX Street

FX Street

FXStreet is the leading independent portal dedicated to the Foreign Exchange (Forex) market. It was launched in 2000 and the portal has always been proud of their unyielding commitment to provide objective and unbiased information, to enable their users to take better and more confident decisions.