- Etheruem price on Monday trading up with decent gains of 3.6% into the second half of the day.
- ETH/USD bounced off a large daily support area seen at $133, a failure to hold could see a free-fall back down to $100.
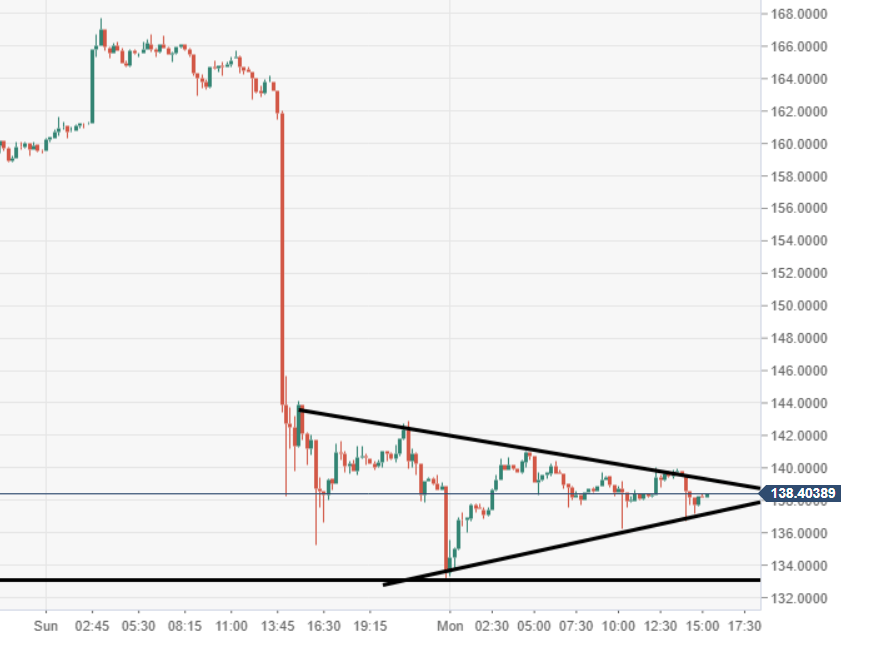
ETH/USD 15-minute chart
- Narrowing price action observed via the 15-minute chart view, indicating of a potential near-term explosive breakout.
Spot rate: 138.39
Relative change: +3.62%
High: 141.04
Low: 133.28
Trend: Bullish
Trends:
Daily SMA20: 128.81
Daily SMA50: 124.49
Daily SMA100: 122.95
Daily SMA200: 179.85
Levels:
Previous Daily High: 167.77
Previous Daily Low: 133.2
Previous Weekly High: 152.82
Previous Weekly Low: 123.04
Previous Monthly High: 163.23
Previous Monthly Low: 102.17
Daily Fibonacci 38.2%: 146.4
Daily Fibonacci 61.8%: 154.56
Daily Pivot Point S1: 121.89
Daily Pivot Point S2: 110.26
Daily Pivot Point S3: 87.32
Daily Pivot Point R1: 156.46
Daily Pivot Point R2: 179.4
Daily Pivot Point R3: 191.04
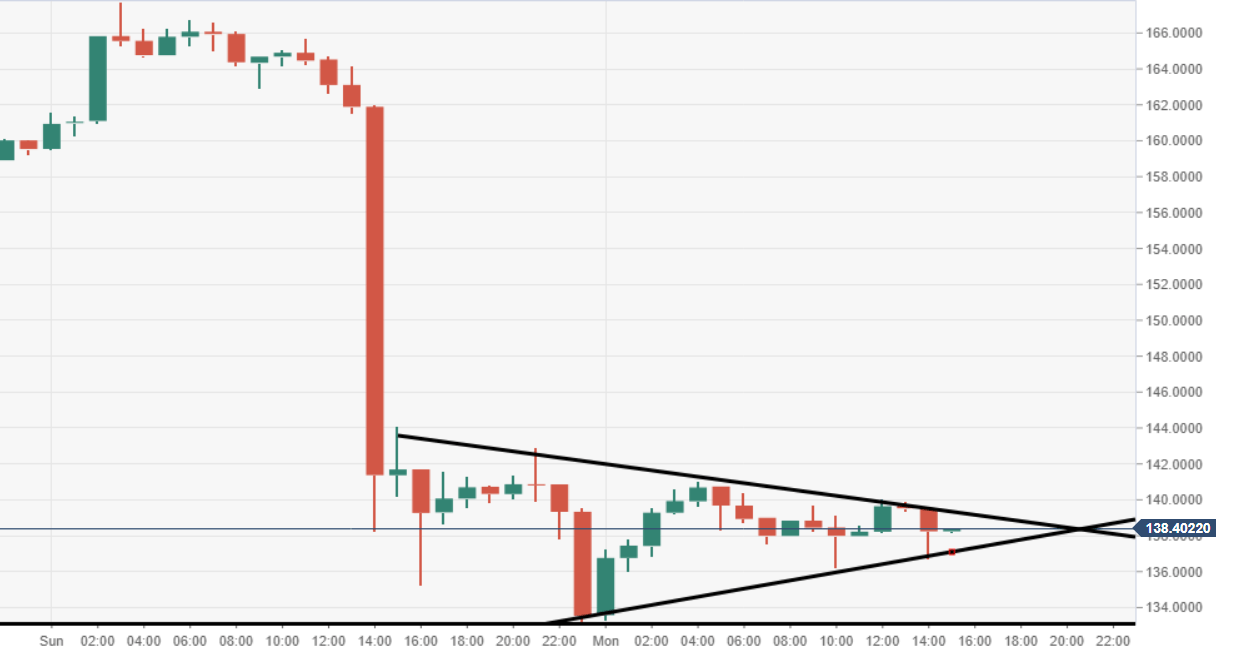
ETH/USD 60-minute chart
- Price action narrowing within a pennant pattern structure, something seen with several of its peers.
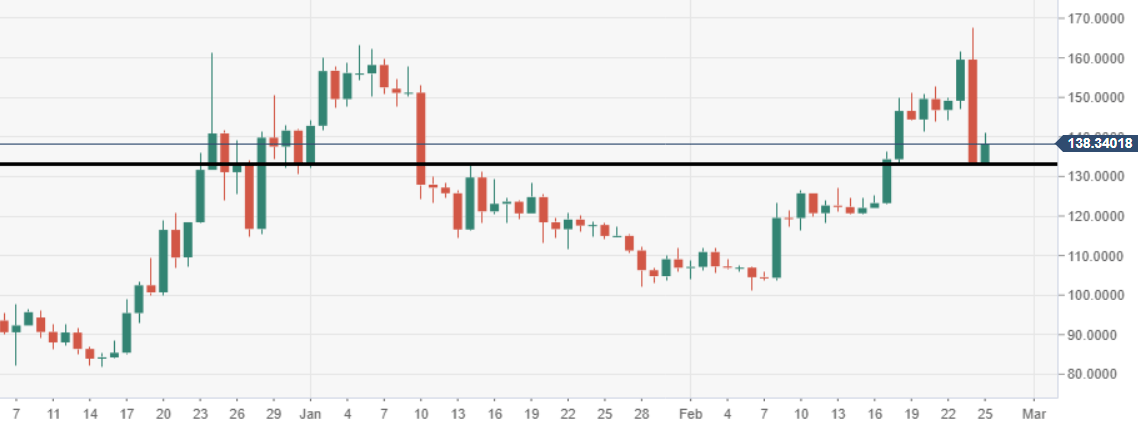
ETH/USD daily chart
- Price action managed to catch a firm chunky bounce off key daily support, eyed at the $133 level.