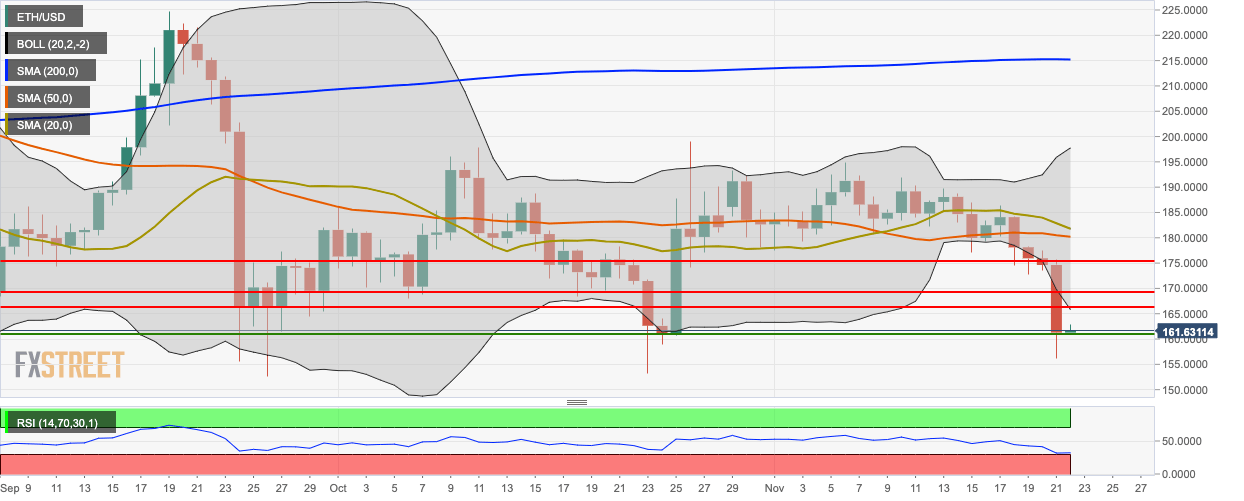
- ETH/USD dropped from $174.70 to $161.25 this Thursday.
- The daily chart shows that the RSI indicator is trending around 32.35, next to the oversold zone.
ETH/USD daily chart
The daily ETH/USD price has dropped below the 20-day Bollinger curve, indicating that it is undervalued. The Bollinger jaw has widened, showing increasing price volatility. The is also floating below the 200-day Simple Moving Average (SMA 200), SMA 50 and SMA 20 curves.
ETH/USD 4-hour chart
The 4-hour chart shows that the price dropped from $175.25 to $160.45 in 16 hours. Having found support at the $160.45 level and gone up to $161.75. The Elliott Oscillator has had five straight red sessions. The Bollinger width has gone up from 0.067 to 0.14, indicating increasing volatility.
ETH/USD hourly chart
The hourly ETH/USD is trending in an upwards channel formation and is floating below the SMA 20, SMA 50 and SMA 200 curves. Currently, the hourly price has found resistance at the $162.75 line and dropped to $161.75.
Key Levels

-637099898433346866.png)
-637099898077087762.png)
