- Ethereum price seen down over 3% on Tuesday, as bears continue to test key near-term area of support.
- ETH/USD is currently trading at the 38.2% Fibonacci, supporting the price from further downside.
- Recent price action has formed a descending wedge pattern, seen on the 15-minute time frame.
ETH/USD 30-minute chart
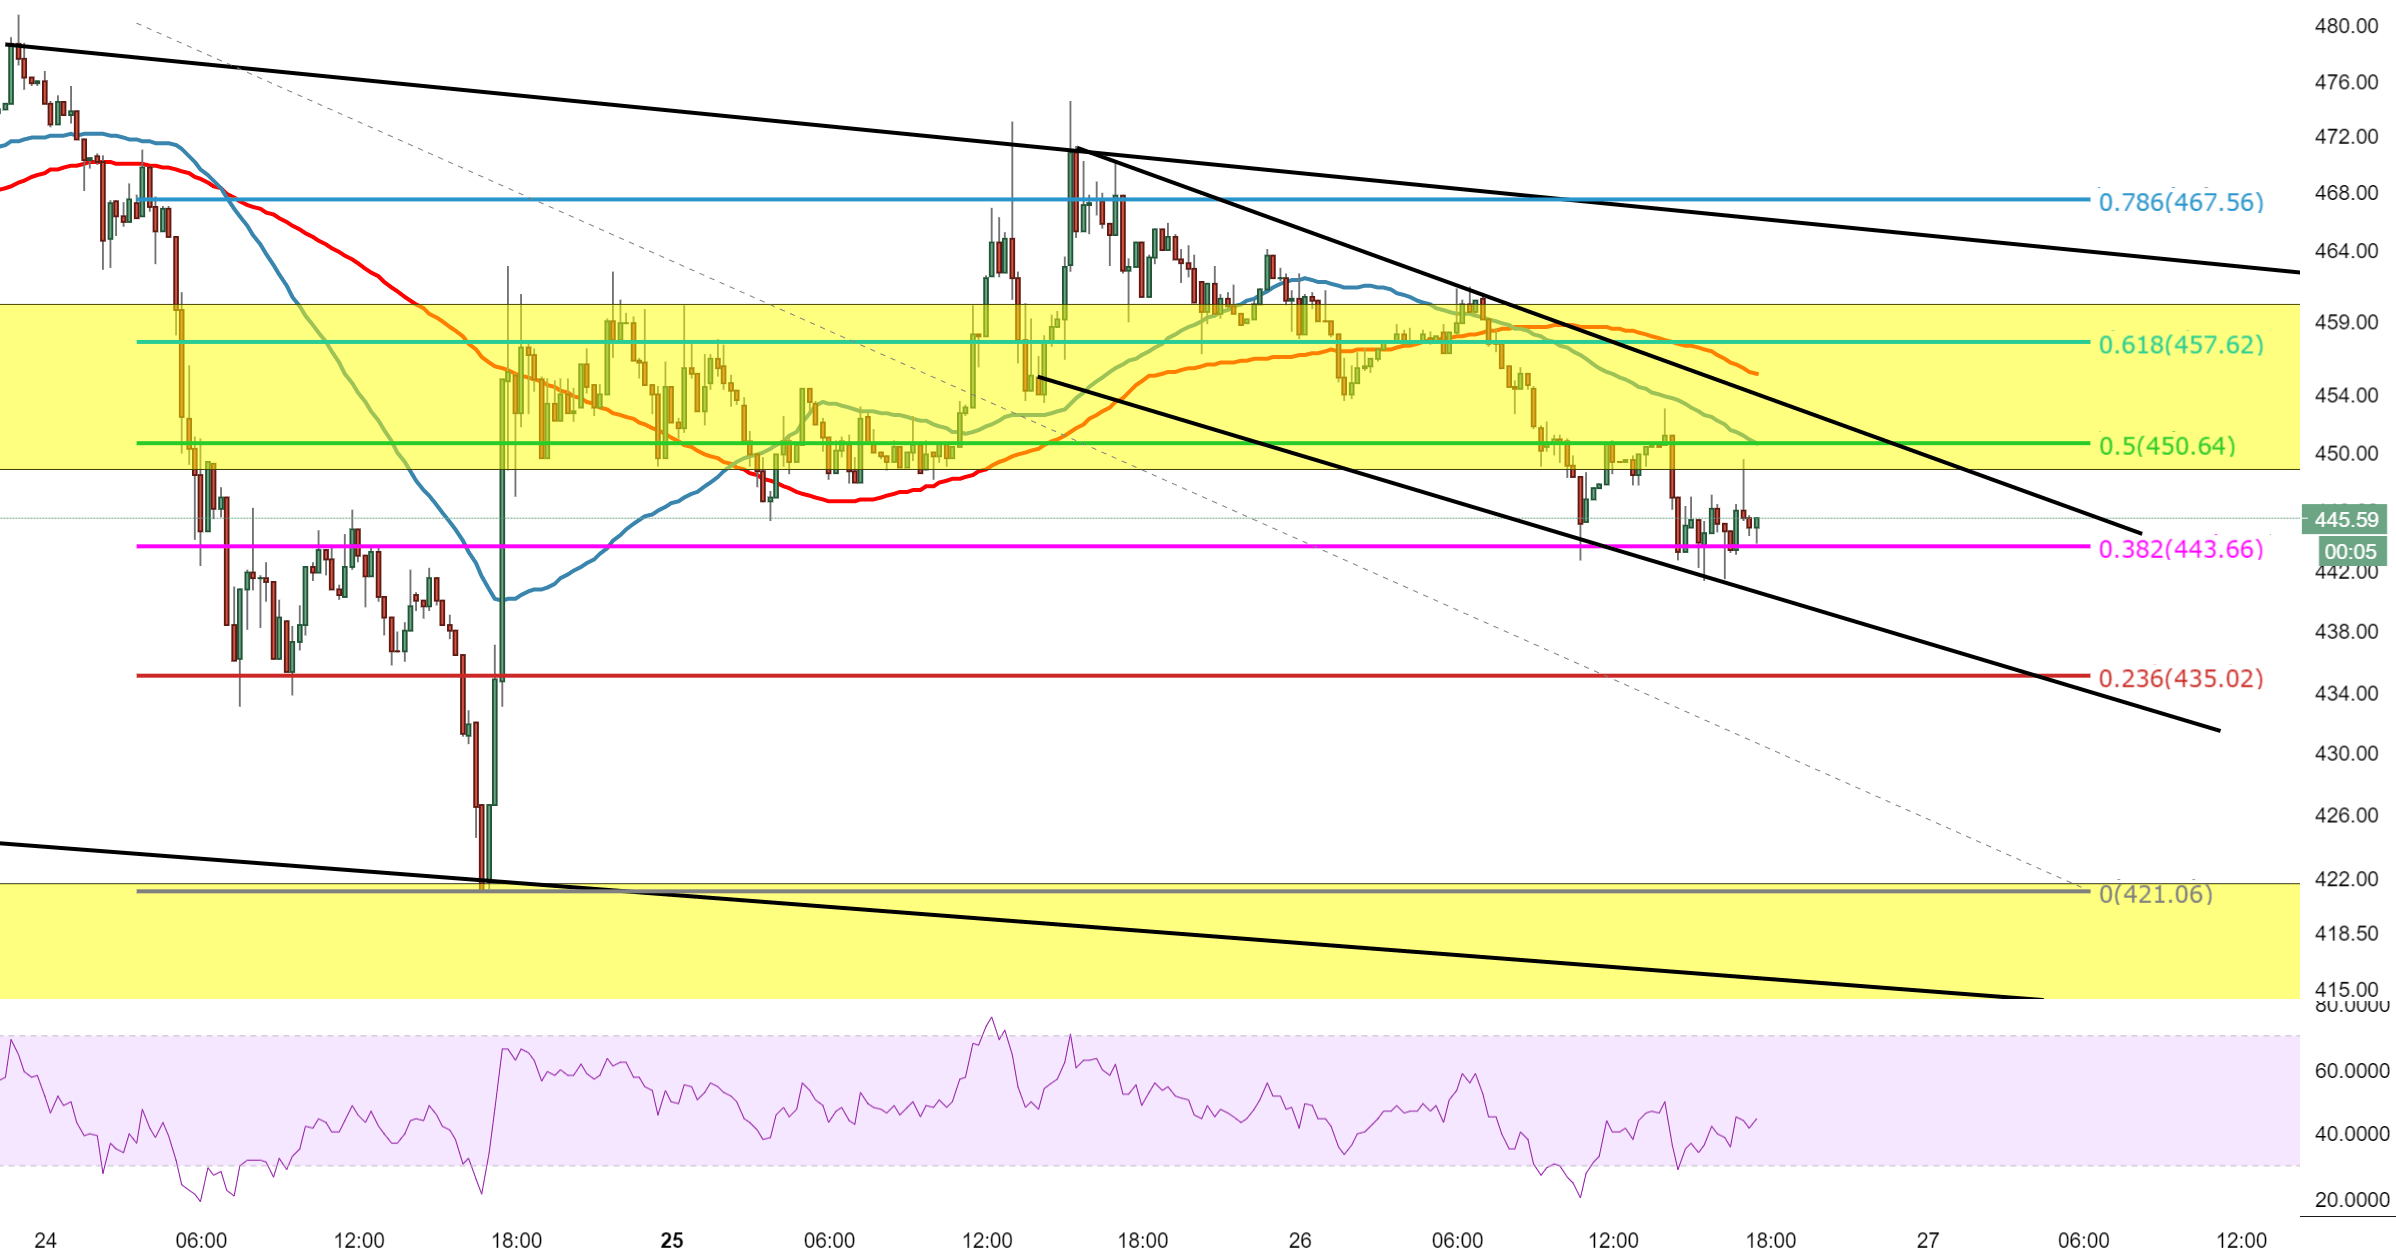
Spot rate: 445.36
Relative change: -3.10%
High: 461.40
Low: 441.30
Trend: Bearish
Support 1: 443.00, 38.2% Fibonacci & (support on 15-minute chart).
Support 2: 439.32, lower support of descending channel.
Support 3: 434.93, (support on 15-minute chart).
Resistance 1: 450.49, 50MA & 50% Fibonacci.
Resistance 2: 453.69, upper resistance of descending channel.
Resistance 3: 455.63, 100MA.
