EUR/USD had a choppy week, feeling some pressure but not falling too far. Inflation data stands out just before the May 1st holiday. Here is an outlook for the highlights of this week and an updated technical analysis for EUR/USD.
Greek headlines drifted between deteriorating conditions and Grexit talk to optimism or at least a deadline delay. This had a growing impact on the common currency. For a change, most euro-zone figures fell short of expectations and that also took its toll. In the US, data began looking better, with existing home sales beating expectations. But it’s far from looking rosy and as the week advanced, the dollar was hit by weak data. All in all, it’s a mixed picture with quite a lot of action.
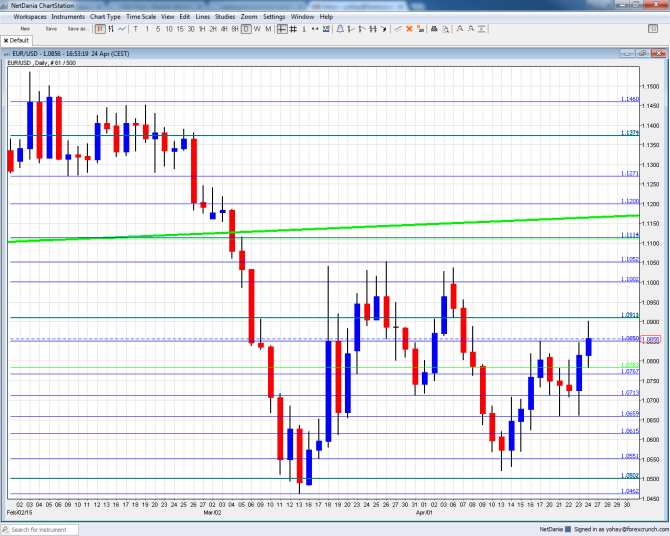
[do action=”autoupdate” tag=”EURUSDUpdate”/]EUR/USD daily chart with support and resistance lines on it. Click to enlarge:
- German Import Prices: Wednesday, 6:00. Prices of imported goods also feed into inflation calculations and are impacted by the exchange rate. A surprising jump of 1.4% was seen in February. Another rise of 0.4% could be seen now
- German CPI: Wednesday, state data released during the morning with the all-German read coming at 12:00. The largest economy in the euro-zone saw prices rising by 0.5% in March, a second consecutive beat of expectations. A drop of 0.1% is expected in the early release for April.
- ECB monetary data: Wednesday, 8:00. The European Central Bank has made a lot of efforts to pump money, and this is bearing fruit. The annual rise in the M3 Money Supply stands at 4%, after long months of a very slow rise in the amount of money in circulation. 4.3% is predicted now Private loans are still contracting on a y/y basis, at 0.1% in February. The figures for March are expected to show an improvement, especially on the background of QE implementation with an annual rise of 0.2%.
- French Consumer Spending: Thursday, 6:45. The zone’s second largest economy has enjoyed 4 consecutive months of growing spending by consumers, but the figure for February fell short of predictions by rising only +0.1%. A drop of 0.5% is on the cards now.
- Spanish Flash GDP: Thursday, 7:00. As one of the first countries that releases in GDP data, this will be closely watched. The country enjoyed a strong growth rate of 0.7% q/q in the last quarter of 2014. According to government officials, growth could even be stronger now: 0.8%.
- Spanish Flash CPI: Thursday, 7:00. Growth is partially built on a fall in prices. The zone’s fourth largest economy suffered from one of the worst levels of deflation, but this seems to be waning off. For March, a fall of 0.7% was seen in CPI. The same annual drop in prices is expected in the preliminary number for April.
- German Unemployment Change: Thursday, 7:55. Germany enjoyed many months of drops in the number of unemployed. In February, Germany saw a drop of 15K and the unemployment rate stood on 6.5%. Another similar drop is on the cards: -14K.
- ECB Economic Bulletin: Thursday, 8:00. The data in this report is what the governing council of the central bank sees before making its monetary decisions. In the April rate decision, no policy change was announced and Draghi shrugged off talk about QE tapering despite the economic improvement. This could give some more insight into the current conditions.
- Inflation data: Thursday, 9:00. The euro-zone remained in deflation in March, with a drop of 0.1% in prices, but this was better than expected. Core inflation stood on 0.6% and showed that the underlying weakness – it is not only oil prices. Headline CPI carries expectations for a flat 0% while core CPI is expected to stand at 0.6% once again.
- Unemployment Rate: Friday, Thursday, 9:00. After a few signs of falls in unemployment, the situation isn’t too good. At 11.3%, the old continent has a long way to go. A small drop is on the cards now for March, to 11.2%.
* All times are GMT
EUR/USD Technical Analysis
Euro/dollar began the week with a slide that extended below 1.07 but eventually the pair found some stability around the 1.0715 level (mentioned last week). The pair then shot up and scratched the 1.09 level before sliding.
Live chart of EUR/USD: [do action=”tradingviews” pair=”EURUSD” interval=”60″/]
Technical lines from top to bottom:
The round number of 1.12 is clear resistance. It is followed by a low seen in January of 1.1113 which is nearly 0.90 on USD/EUR.
1.1050 was a high point in March 2015 and is another line of resistance before the round level 1.10. This is still a battle line.
The next line was minor support back in October 1999: 1.0910. It was resistance back then and was tested once again in March 2015. This is followed by 1.0815 which worked in both directions.
The next line is 1.0760, which was the low point in both July and August 2003. 1.0715 joins the chart after temporarily capping the pair in April 2015.
1.0660 worked nicely as support in April 2015. 1.0615, which worked in both directions during March 2015 and is better at support.
Another minor line is 1.0550, for a role as support in the same period of time. The very round level of 1.05 served as support during 2003. The lowest level in over 12 years is 1.0462 and this makes it critical support.
From here on, we are at levels last seen over a decade ago. We have some support at 1.0360: this was the low point in January 2003. Further down, 1.0170 worked as resistance back in November 2012. It is close to the swing high of 1.0208 seen in July of that year.
Below this point we have the very obvious level of 1 – EUR/USD parity, which is already eyed by more and more analysts
I remain bearish on EUR/USD
If this is all the pair can do on horrible US data, it certainly serves as a bearish sign. In addition to the determined ECB on QE, we have a souring of euro-zone data. Assuming the US economy did not contract in Q1, there is room for falls.
In our latest podcast we take a deep dive into the various euro-zone issues, a look at China and a new trading education initiative
Subscribe to Market Movers on iTunes
Further reading:
- For a broad view of all the week’s major events worldwide, read the USD outlook.
- For the Japanese yen, read the USD/JPY forecast.
- For GBP/USD (cable), look into the British Pound forecast.
- For the Australian dollar (Aussie), check out the AUD to USD forecast.
- USD/CAD (loonie), check out the Canadian dollar forecast
- For the kiwi, see the NZDUSD forecast.
