EUR/USD rallied hard on a mix of not-so-good mews from around the world. Has it found a new driver? The highlights of the last full week of August are inflation figures and an important German survey. Here is an outlook for the highlights of this week and an updated technical analysis for EUR/USD.
German manufacturing PMI beat expectations, but it was rather the bad news that lifted the pair. There is a growing fear about a global downturn. It began in China and spread to other places. With the euro now functioning as a funding currency, bad news means good news for the euro. This also bears truth when the crisis is brewed at home: Greece. The Greek government resigned and the resulting uncertainty has certainly not derailed the single currency. It also helped that the Fed remained hesitant about a hike in September. With worsening global conditions since that last Fed meeting, odds continue falling, and the dollar follows.
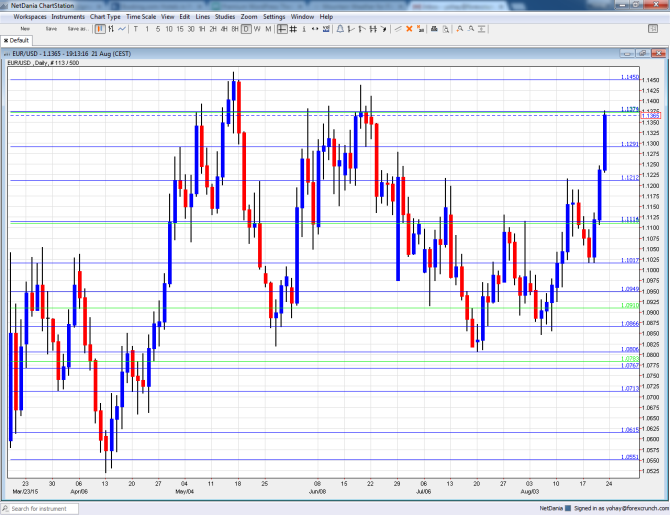
[do action=”autoupdate” tag=”EURUSDUpdate”/]EUR/USD daily graph with support and resistance lines on it. Click to enlarge:
- German Final GDP: Tuesday, 6:00. According to the initial estimate, the German economy grew by 0.4% in Q2 2015, a bit below expectations and weighing on overall EZ growth. This number will likely be confirmed this time.
- German Ifo Business Climate: Tuesday, 8:00. Contrary to the ZEW figure, the numbers coming out from IFO have remained very stable, standing at 108 in the last read. A small slide to 107.6 is on the cards.
- Belgian NBB Business Climate: Tuesday, 13:00. The indicator comes from a small country, but is considered a bellwether to the wider euro area. The latest read for July showed stability, albeit at negative levels: a score of -4.1, still reflecting worsening conditions. We now expect -3.2 points.
- German Import Prices: Prices of imported goods have an impact on inflation. In Europe’s case, the fall in the prices of oil, imported from outside, weighed heavily on headline inflation, which is the ECB’s goal. Another drop of 0.3% is expected after the slide of 0.5% beforehand.
- ECB Monetary data: Thursday, 8:00. It seems that the central bank’s monetary easing is making credit conditions easier and money supply is looking good. An annual growth rate of 5% was seen in money supply in June. Private loans, which were shrinking not that long ago, advanced by 0.6%. A rise of 4.9% in money supply and 0.7% in loans is on the cards now.
- German CPI: Friday, during the morning from the various German states, with a full German read at 12:00. Prices in the zone’s locomotive rose by 0.2% in July. We now get the first read for August which is expected to show a slide of 0.1%.
- Spanish Flash CPI: Friday, 7:00. The zone’s fourth largest economy has seen prices stabilize in July, with 0% change year over year. This came after long months of deflation. But now, a return to negative numbers is on the cards, with a slip to -0.1%.
* All times are GMT
EUR/USD Technical Analysis
Euro/dollar started off the week with a slide but things later changed and it eventually reached resistance at 1.1290 (mentioned last week).
Live chart of EUR/USD: [do action=”tradingviews” pair=”EURUSD” interval=”60″/]
Technical lines from top to bottom:
We start from higher ground this time: 1.1680 capped the pair in January on its way down. The next line is a clear separator of ranges: 1.1535. It was last seen in January as well.
The very round 1.15 level is of importance thanks to its psychological role. It is closely followed by 1.1460 that served as resistance earlier in the year.
The historic line of 1.1373 (from November 2003) still has a role as resistance. 1.1290, which was a peak in April and support in February is significant resistance.
1.1215, which capped the pair both in June and in August is clear resistance. It is followed by a low seen in January of 1.1113 which is nearly 0.90 on USD/EUR.
1.1050 returns to the chart after serving as a stepping stone for the pair to rise to higher ground. 1.0950 is a pivotal line in the range.
1.0865 provided some support in late May and is weak support before a stronger line: 1.0810, which was the bottom in July also nicely coincides with the low seen in May and is strong support..
The next line is 1.0760, which was the low point in both July and August 2003. 1.0715 joins the chart after temporarily capping the pair in April 2015.
I am neutral on EUR/USD
Risk aversion is what drove money into the euro. This is the outcome of the worries about China and the fresh mess in Greece. These factors could continue boosting the euro, which is behaving as a safe haven currency. On the other hand, after the current rally, we could see some profit taking as well as worries from the ECB. With so many big events in the first week of September, the pair might choose to trade in its new, well defined range.
In our latest podcast we collect the crashes: commodities, Fed hike and later Greece
Further reading:
- For a broad view of all the week’s major events worldwide, read the USD outlook.
- For the Japanese yen, read the USD/JPY forecast.
- For GBP/USD (cable), look into the British Pound forecast.
- For the Australian dollar (Aussie), check out the AUD to USD forecast.
- USD/CAD (loonie), check out the Canadian dollar forecast
- For the kiwi, see the NZDUSD forecast.
