EUR/USD dropped for the third week in a row, but managed to close above the lows. Can we expect a correction now? GDP figures are at the center of attention, with the big question: did Germany slip into a recession? Here is an outlook on the highlights of this week and an updated technical analysis for EUR/USD.
A challenge to Draghi’s leadership style and policy helped the euro recover on speculation that the easing tools are limited. However, Draghi defied discontent by reaffirming the message that the balance sheet is set to expand towards the 2012 levels, and that all tools are on the table. The euro was hit hard. Help came from the other side of the Atlantic, where the headline Non-Farm Payrolls came short at 214K. Despite positive internal figures and other encouraging US figures, EUR/USD managed to escape the lows. What’s next?
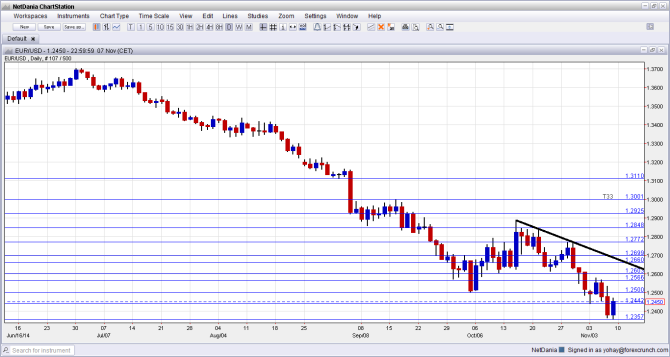
[do action=”autoupdate” tag=”EURUSDUpdate”/]EUR/USD daily graph with support and resistance lines on it. Click to enlarge:
- Italian Industrial Production: Monday, 9:00. The euro-zone’s third largest economy is struggling economically. After industrial output managed to rise by 0.3% in August, a growth rate of 0.2% is predicted for September. This release will help shape the all euro-zone output read.
- Sentix Investor Confidence: Monday, 9:30. This wide survey of 2800 analysts and investors has dropped sharply to in October to -13.7 points, reflecting pessimism for a second consecutive month. A recovery of sorts is expected now, with a score of -6.9 points, still in negative territory.
- German WPI: Wednesday, 7:00. The Wholesale Price Index is yet another measure of inflation in the euro-zone’s locomotive. For the month of October, a rise of 0.2% is expected to follow September’s 0.1% rise, which broke a streak of falls.
- Industrial Production: Wednesday, 10:00. Industrial output fell by 1.8% in August, mostly due to Germany’s plunge. We now know that the fall wasn’t that sharp, and that German output rose in September. So, a growth rate of 0.6% is forecast for September.
- German Final CPI: Thursday, 7:00. Leading to Friday’s final CPI read, we will probably see a confirmation of Germany’s drop of 0.3% in monthly inflation. Year over year, the EU standard HICP rose by only 0.7%. Also this is expected to be confirmed now.
- French CPI: Thursday, 7:45. The zone’s third largest economy saw prices stall in September and now we expected a slide of 0.1% m/m, that will feed into the final euro-zone read on Friday. Any big surprise could change expectations for the final number.
- ECB Monthly Bulletin: Thursday, 9:00. One week after Draghi’s determined message regarding fighting low inflation, we will get the ECB’s view. While the updated forecasts are due only in December, this report could show how bad the situation is in the eyes of the central bank.
- GDP Data: Friday, 6:30 in France, 7:00 in Germany, 9:00 in Italy and 10:00 for the whole euro-zone. A busy morning awaits EUR traders with the preliminary prints of GDP growth for Q3 2014. France is expected to report a moderate growth rate of 0.1% after stalling in Q2. The focus is on Germany, which saw a contraction in Q2 of 0.2% and is now officially expected to return to growth of 0.1%, avoiding an outright recession. However, some indicators released during Q3, such as factory orders and business confidence open the door to seeing the euro-zone’s powerhouse enter a recession. Italy is already in recession with two consecutive quarters of contraction, and a third one is expected to follow, with -0.1% after -0.2% beforehand. For the whole euro-zone, a growth rate of 0.1% is expected after a flat read in Q2 and +0.2% in Q1. Note that if we get big surprises in French and especially German data, real expectations will have been adjusted by this release.
- French Non-Farm Payrolls: Friday, 7:45. France saw employment grow by 0.1% in Q2 and Q3 is expected to show a rise of 0.2%, even though jobless claims are consistently rising in second largest European economy.
- Inflation data: Friday, 10:00. The initial read for October showed that inflation stayed stubbornly low, at 0.4% in headline CPI and +0.7% in CPI. This certainly had an impact on the ECB’s dovish stance. These numbers are expected to be confirmed now, but revisions are certainly not uncommon. Core inflation is at its lowest level, so a downgrade here would be especially influential.
* All times are GMT
EUR/USD Technical Analysis
Euro/dollar started the week by falling to support at 1.2440, mentioned last week. It then bounced back and even hit resistance at 1.2570. A second fall saw it hit 1.2360 before climbing back and closing at 1.2450. The pair’s technical behavior undoubtedly justifies its ranking in the top 5 predictable currency pairs.
Live chart of EUR/USD: [do action=”tradingviews” pair=”EURUSD” interval=”60″/]
Technical lines from top to bottom:
We start from lower ground this time. 1.3050 serves as a minor line before the key line: 1.30, which is more than a round number. The pair bounced off this line before making the big fall.
Below 1.30, we find 1.2960 which capped the pair’s recovery attempts after it fell to lower ground. The 1.2920 level was the initial low and should be watched as well.
1.2850 worked as support in September and later capped the pair.1.2775 proved to be a stubborn top in October 2014 and is the important resistance line to the upside.
1.27 is a round number and also worked as resistance to a recovery attempt. This is followed by 1.2660 – which marks the beginning of long term uptrend support.
Below, 1.2570 is the initial low seen in October and now a line of resistance. The next line is critical: of 1.25, which is USD/EUR at 0.80. The pair flirted with this line and even dipped below it in October. This is key support.
Even lower, 1.2440 was a swing high in August 2012 and it is followed by 1.2360, which worked as support more than once, including in November 2014.
1.2250 served as support several times in that summer, and 1.2170 was the “shoulder” in the inverse H&S pattern around the same time. The last line is the 2012 low of 1.2040.
Downtrend resistance
As the thick black line shows, the pair is trading under downtrend resistance since mid October. This line should be watched in recovery attempts.
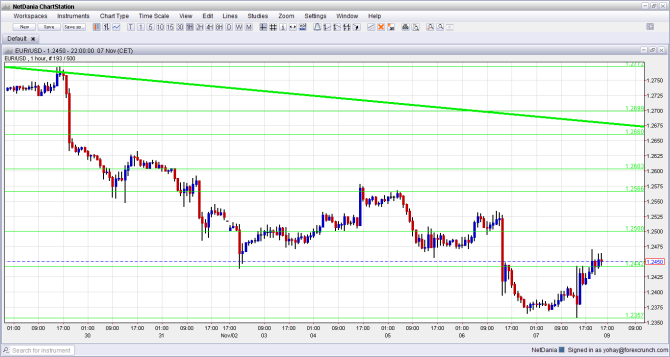
Here is closer look at recent movements via the hourly chart:
I turn from bearish to neutral on EUR/USD
The general direction remains down, with some analysts targeting 1.20 and others even go for 1.18. Monetary policy divergence isn’t fully priced in. The ECB made it crystal clear that it is ready to print more euros to battle low inflation. In the US, jobs are being added at a steady pace, and even salary rises could be around the corner, forcing the Fed to act sooner than later.
Having said all that, forex trading is never a one way street. Back in October, EUR/USD bottomed out at clear support at 1.25 after the NFP and began a correction. We may be seeing some kind of correction now, with the bounce off 1.2360 and the close above 1.2440. A correction isn’t likely to last for too long or to go too far, but another immediate leg lower seems less likely.
Subscribe to our podcast on iTunes.
Further reading:
- For a broad view of all the week’s major events worldwide, read the USD outlook.
- For the Japanese yen, read the USD/JPY forecast.
- For GBP/USD (cable), look into the British Pound forecast.
- For the Australian dollar (Aussie), check out the AUD to USD forecast.
- USD/CAD (loonie), check out the Canadian dollar forecast
- For the kiwi, see the NZDUSD forecast.
