EUR/USD had a wild week, where the weakness of the dollar beat the weakness of the euro and sent the pair higher in exciting market action. PMIs and the EU Economic Summit are set to stand out. Here is an outlook on the highlights of this week and an updated technical analysis for EUR/USD.
Pessimism among German businesses as reflected by ZEW, a plunge in industrial output, a cut of German forecasts and spiking peripheral yields all weighed on the euro. Data later improved with a small upgrade of core CPI, but the driver of the pair’s gains came from the other side of the pond. First it was weakness in US retail sales that sparked an exaggerated sell off, and then it was FOMC member James Bullard that suggested no end to QE that hit the dollar. Markets ignored the best jobless claims in over a decade. Will the dollar sell off send the pair to 1.30?
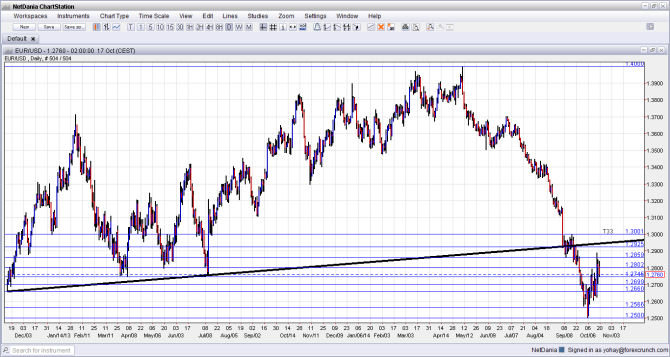
[do action=”autoupdate” tag=”EURUSDUpdate”/]EUR/USD daily graph with support and resistance lines on it. Click to enlarge:
- German PPI: Monday, 6:00. Producer prices in the euro-zone’s largest country add more insight about inflation. After a slide of 0.1% m/m in August, a rise is now expected for the month of September.
- Current Account: Monday, 8:00. The euro-zone enjoys a wide current account surplus, mostly thanks to Germany. This is one of the reasons keeping the euro bid. Given the better than expected euro-zone trade balance, the wider current account number is likely to follow suit. It stood on 18.7 billion euros in July and probably was wider in August: 21.3 billion euros.
- Bundesbank Monthly Report: Monday, 10:00. The German central bank is at odds with the latest moves by the ECB, but still has a strong influence. This report is especially interesting to watch after the recent downgrades to growth and inflation forecasts seen by the German government.
- EU Economic Summit: Thursday and Friday. The leaders of the 28 strong European Union, also including non-member EU states, have a lot on their plates: youth unemployment, fear of deflation, the French refusal to comply with the guidelines, Germany’s refusal to ditch austerity and the recent worries about Greece are all expected to result in headlines. Can the leaders get together and get Europe growing? Or will this be another failed summit?
- PMIs: Thursday: France at 7:00, Germany at 7:30 and the who euro-zone at 8:00. Both French PMIs have disappointed by standing below the 50 point mark separating growth and contraction, with manufacturing at 48.8 and services at 48.4 points. This forward looking data is worrying for Europe’s second largest economy and it may have worsened in the preliminary figures for October. Drops to 48.6 and 48.4 are expected respectively. Markit set Germany’s manufacturing PMI just under 50, while the services sector enjoyed solid growth in September: 55.7 points. Also here, expectations are for a decline in the so called “locomotive”: to 49.6 and 55 points respectively. For the whole euro-zone, manufacturing stands at 50.3 points while services is at 52.4. These figures have a smaller effect due to the earlier releases for Germany and France. Nevertheless, a drop in both would be worrying. Round number of 50 and 52 are estimated
- Spanish Unemployment Rate: Thursday, 7:00. Spain’s sky high unemployment rate has been falling from the levels above 27% seen in the past, and Spain has been praised for its reforms. However, from the 24.5% reported in Q2, only a small improvement is expected now: 24.1 points. Monthly jobless numbers have been less exciting in Q3 in comparison to Q2.
- Consumer Confidence: Thursday, 14:00. This official survey of 2300 consumers int eh euro-zone has been falling of late, and dropped to -11, reflecting stronger pessimism. Another dip is expected for the month of October: -12 points.
- German GfK Consumer Climate: Friday, 6:00. This highly regarded German survey has been in line with business survey and has declined, reaching 8.3 points in September. Another drop is expected now, to 8,1 points.
- Belgian NBB Business Climate: Friday, 13:00. While coming from a small country, this is considered a good indicator. It has stabilized in September, remaining negative but improving from the previous month. A small dip is expected from September’s -7.2 points, to -7.8 points.
* All times are GMT
EUR/USD Technical Analysis
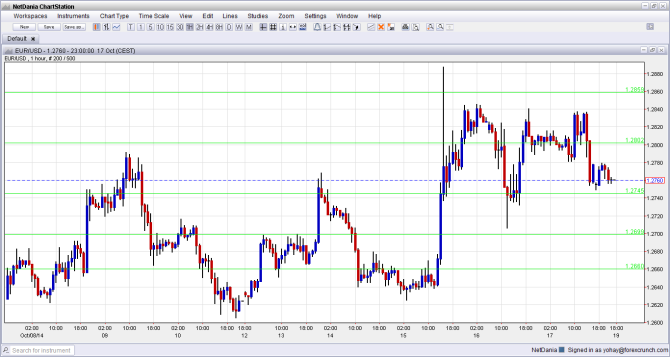
Euro/dollar began the week with a rise from the bottom, but could not conquer the 1.2750 line (mentioned last week) at first. It then dropped back down and later shot higher to spike to 1.2884 before falling to 1.27 and jumping back up. Volatility is storng.
Live chart of EUR/USD: [do action=”tradingviews” pair=”EURUSD” interval=”60″/]
Technical lines from top to bottom:
We begin from higher ground this time. 1.33 was a swing low earlier in the year and works as distant resistance at the moment. 1.31 worked in both direction for quite some time.
1.3050 serves as a minor line before the key line: 1.30, which is more than a round number. The pair bounced off this line before making the big fall.
Below 1.30, we find 1.2960 which capped the pair’s recovery attempts after it fell to lower ground. The 1.2920 level was the initial low and should be watched as well.
1.2860 a place where the pair stopped on the way down in September, and despite the spike, remains of importance. The round number of 1.28, which also worked as support at around the same period of time is weakening, but should still be watched.
1.2750 was a double bottom back in July 2013. This double bottom was breached and immediately worked as resistance. 1.27 is a round number and also worked as resistance to a recovery attempt.
This is followed by 1.2660 – a key line to the downside, which marks the beginning of long term uptrend support. Below, 1.2570 is the initial low seen in October and now a line of resistance.
The next line is critical: of 1.25, which is USD/EUR at 0.80. The pair flirted with this line. This is key support.
Even lower, 1.2445 was a swing high in August 2012 and it is followed by 1.2385, which was stubborn resistance around the same time.
1.2250 served as support several times in that summer, and 1.2170 was the “shoulder” in the inverse H&S pattern around the same time. The last line is the 2012 low of 1.2040.
Here is closer look at recent movements via the hourly chart:
I am neutral on EUR/USD
Europe looks terrible if we look at the data, the forecasts and the direction of the central bank. In addition, the debt crisis seems to be creeping back. However, it now seems that the central bank that is more worried about Europe is the Fed. While US data continues looking good and the option of continuing QE instead of ending it still seems remote, the long term term now meets a strong correction. After the pair rose from the ashes, it could pause to look for a new direction. This pause doesn’t mean no movement: volatility is here to stay, so trade with extra care.
In our latest podcast, talk about: Questions for every trader, crashing oil, state of the UK and global gloom
Subscribe to our podcast on iTunes.
Further reading:
- For a broad view of all the week’s major events worldwide, read the USD outlook.
- For the Japanese yen, read the USD/JPY forecast.
- For GBP/USD (cable), look into the British Pound forecast.
- For the Australian dollar (Aussie), check out the AUD to USD forecast.
- USD/CAD (loonie), check out the Canadian dollar forecast
- For the kiwi, see the NZDUSD forecast.
