- Bitcoin is at an early stage of the bull run; vital on-chain metrics could send the price astronomically upwards.
- Long-term holders seem to have confidence in Bitcoin, hence the possibility of the price rallying massively.
Bitcoin has corrected to $18,000, but several on-chain metrics suggest the bull run is just getting started. Meanwhile, support at $18,000 is crucial to continuing BTC’s uptrend, at least towards $20,000.
The status quo of Bitcoin’s market cycle
A glance at some of the most vital on-chain metrics shows that Bitcoin is still extremely bullish, mainly because most of these indicators are far from their expected tops. In case events turn out just like they did in 2017, there will be potential for Bitcoin to rally ten times from its current price level.
Bitcoin MVRV Z-Score predicts a massive liftoff to $240,000
Glassnode’s BTC’s MVRV Z-Score reveals that Bitcoin’s current market value is only 34% of the top realized in 2017. During the 2017 bull run, the flagship cryptocurrency surged by 1,150% to the incredible all-time high. In case history repeats itself and Bitcoin spikes by 1,150% in the ongoing bull cycle, we can expect prices to balloon to $240,000.
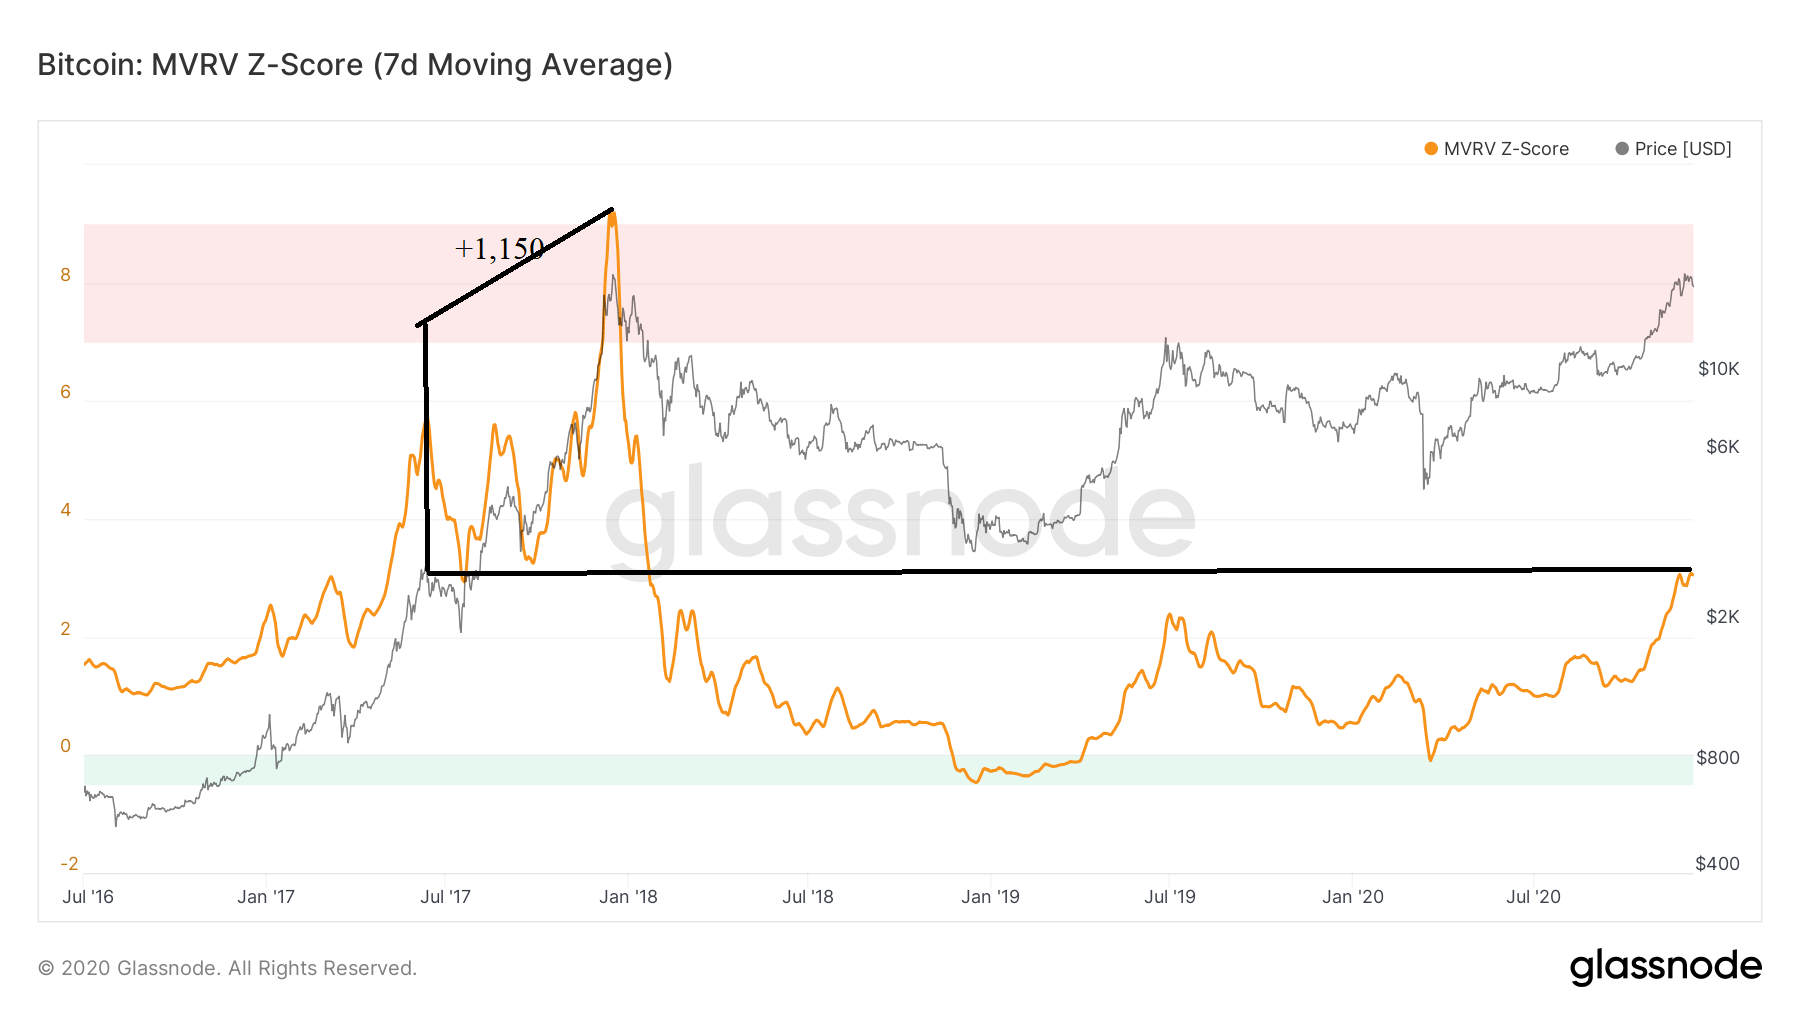
Bitcoin MVRV Z-Score chart
Bitcoin Net Realized Profit/Loss eyes a majestic rise to $286,000
Currently, the Net Realized Profit/Loss sits at 78% from the local top of 2017. At the time, Bitcoin price shot up by 1,400%, hitting the historical ATH. This shows that there is still expansive room for growth in the bullish cycle. Therefore, one can predict Bitcoin hitting highs around $286,000 before the end of the ongoing momentum.
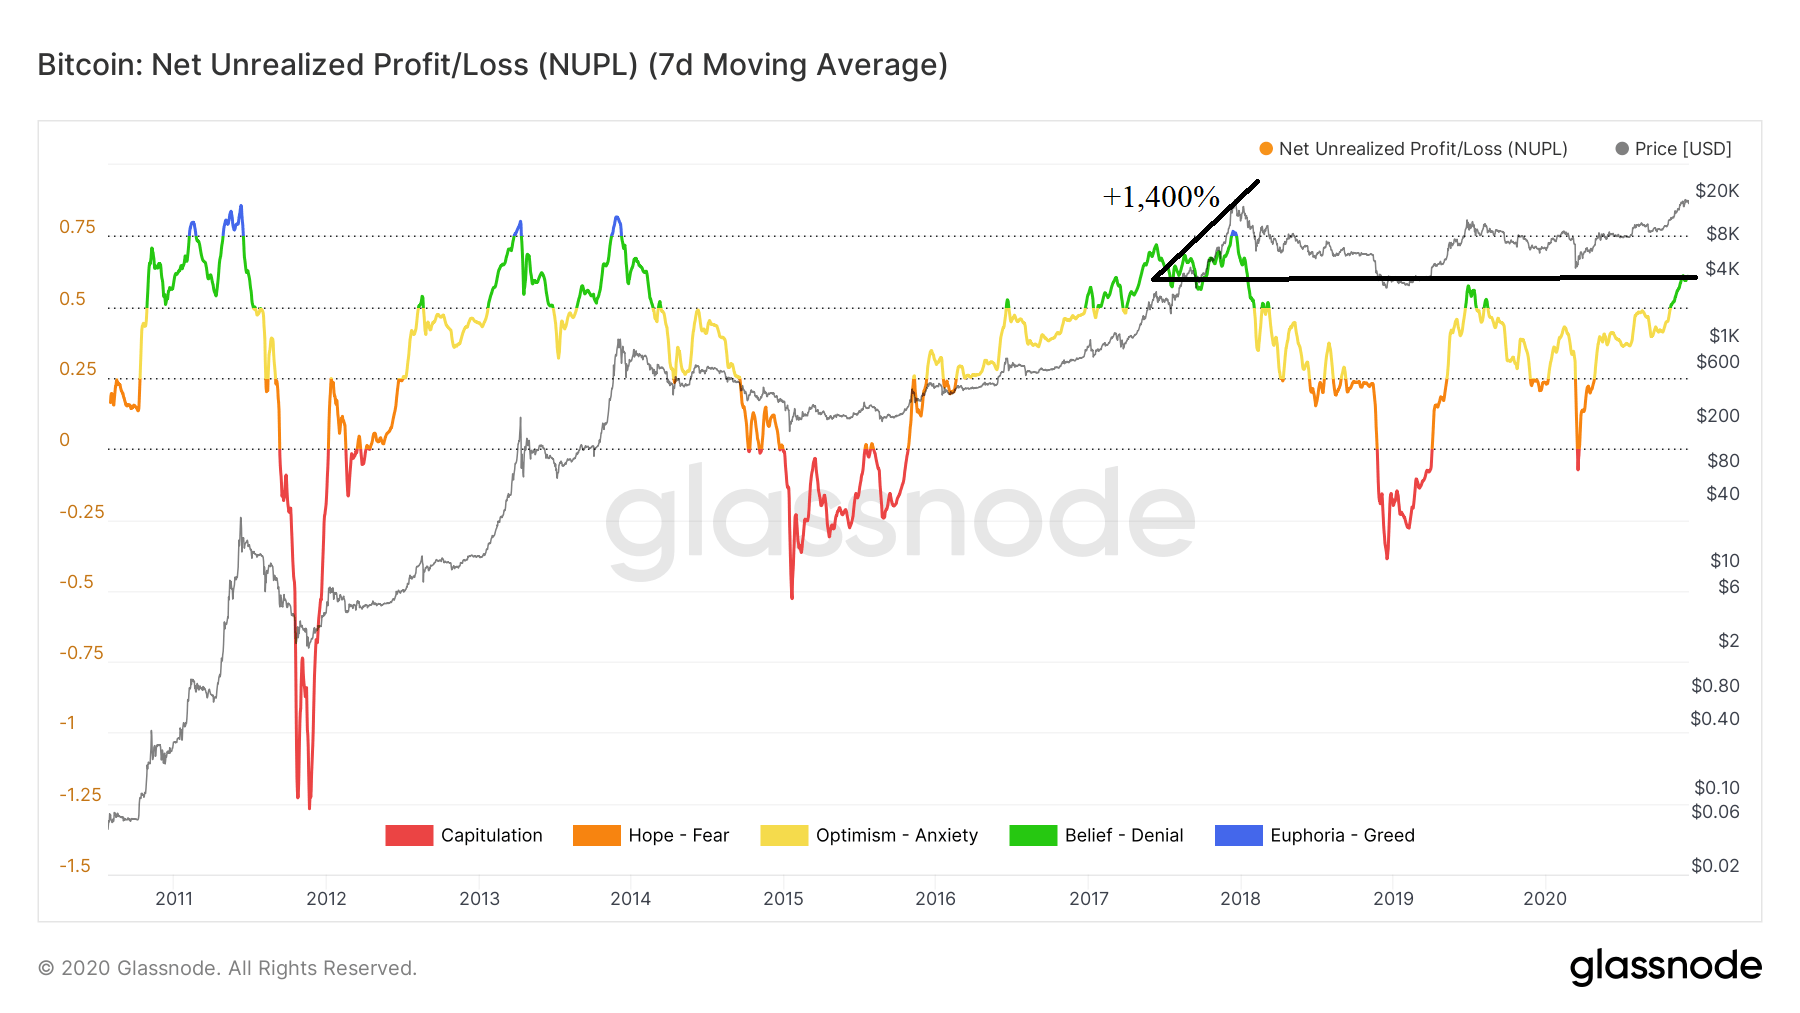
Bitcoin Net Realized Profit/Loss chart
Bitcoin Risk Reserve doubles down on the $240,000 prediction
The Risk Reserve is referred to as price/HODL Bank and tracks the confidence of long term holders in an asset concerning the prevailing price at any given time. The Risk Reserve is low when HODLers’ confidence is high, while the price is low, hence presenting an attractive risk/reward to investors. On the other hand, the Risk Reserve is high when confidence is low while the price is high.
Meanwhile, the Risk Reserve current value is 11% from the top in 2017. During the bullish cycle, then, the price swung upwards by 1,180% to ATH. A similar growth pattern might elevate Bitcoin to $240,000.
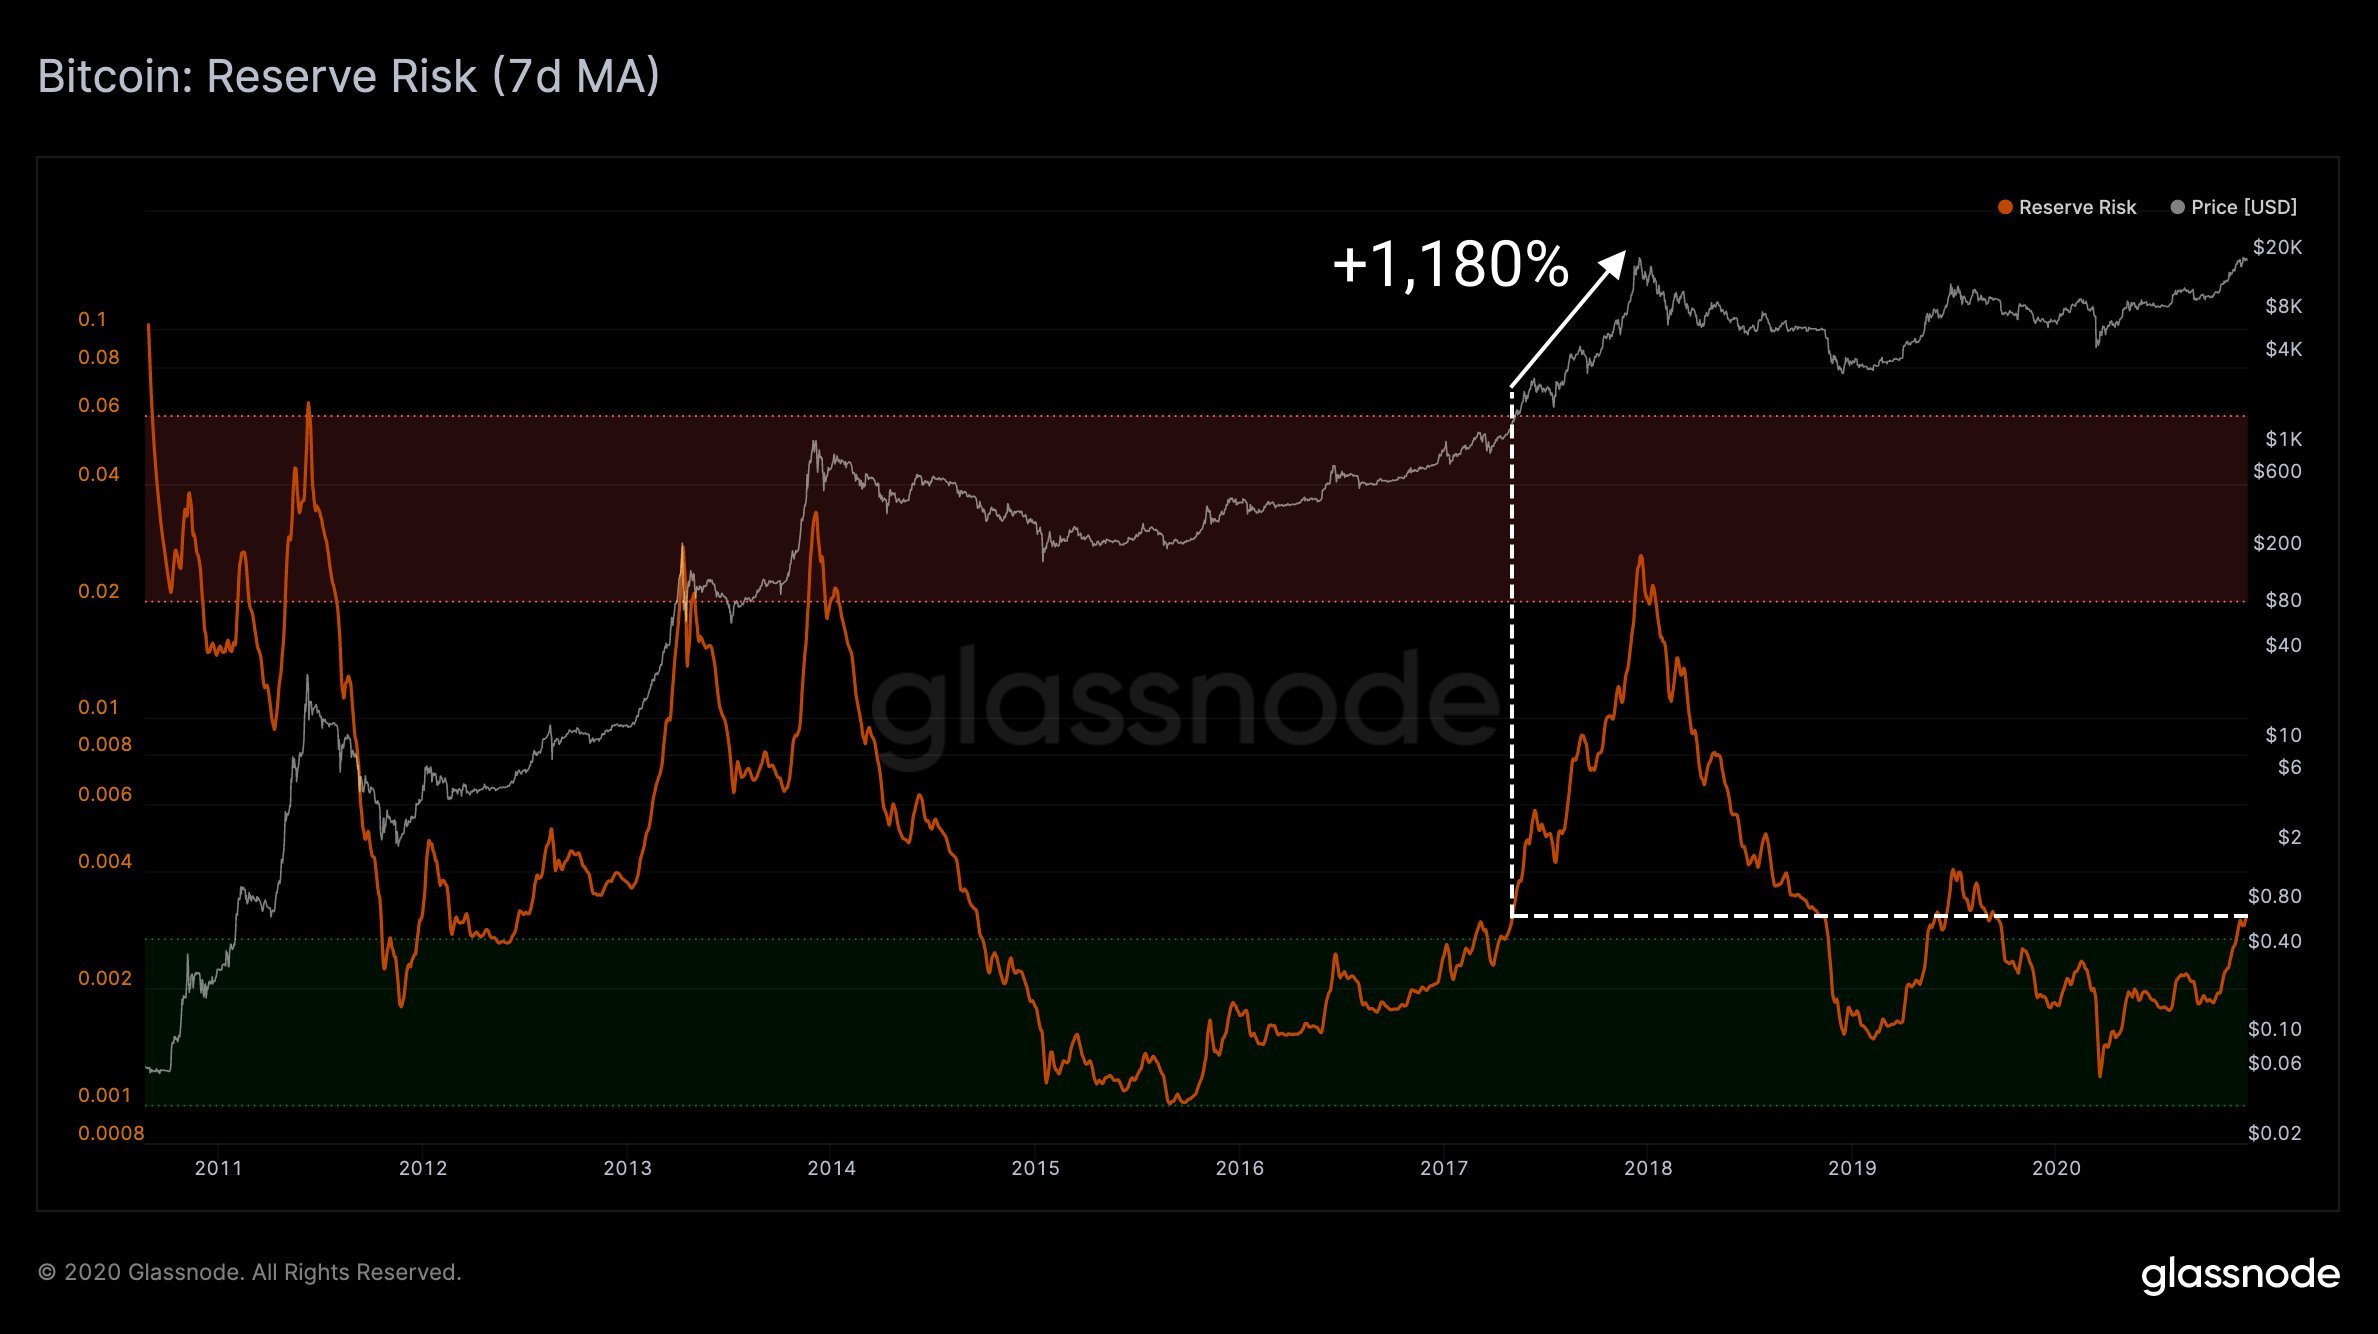
Bitcoin Risk Reserve chart
Bitcoin Market Cap to Thermocap Ratio hints at a possible upswing to $138,000
According to Glassnode, this on-chain indicator is “used to assess if the asset’s price is currently trading at a premium with respect to total security spend by miners.” The metric is periodically adjusted to consider the increase in the asset’s circulating supply.
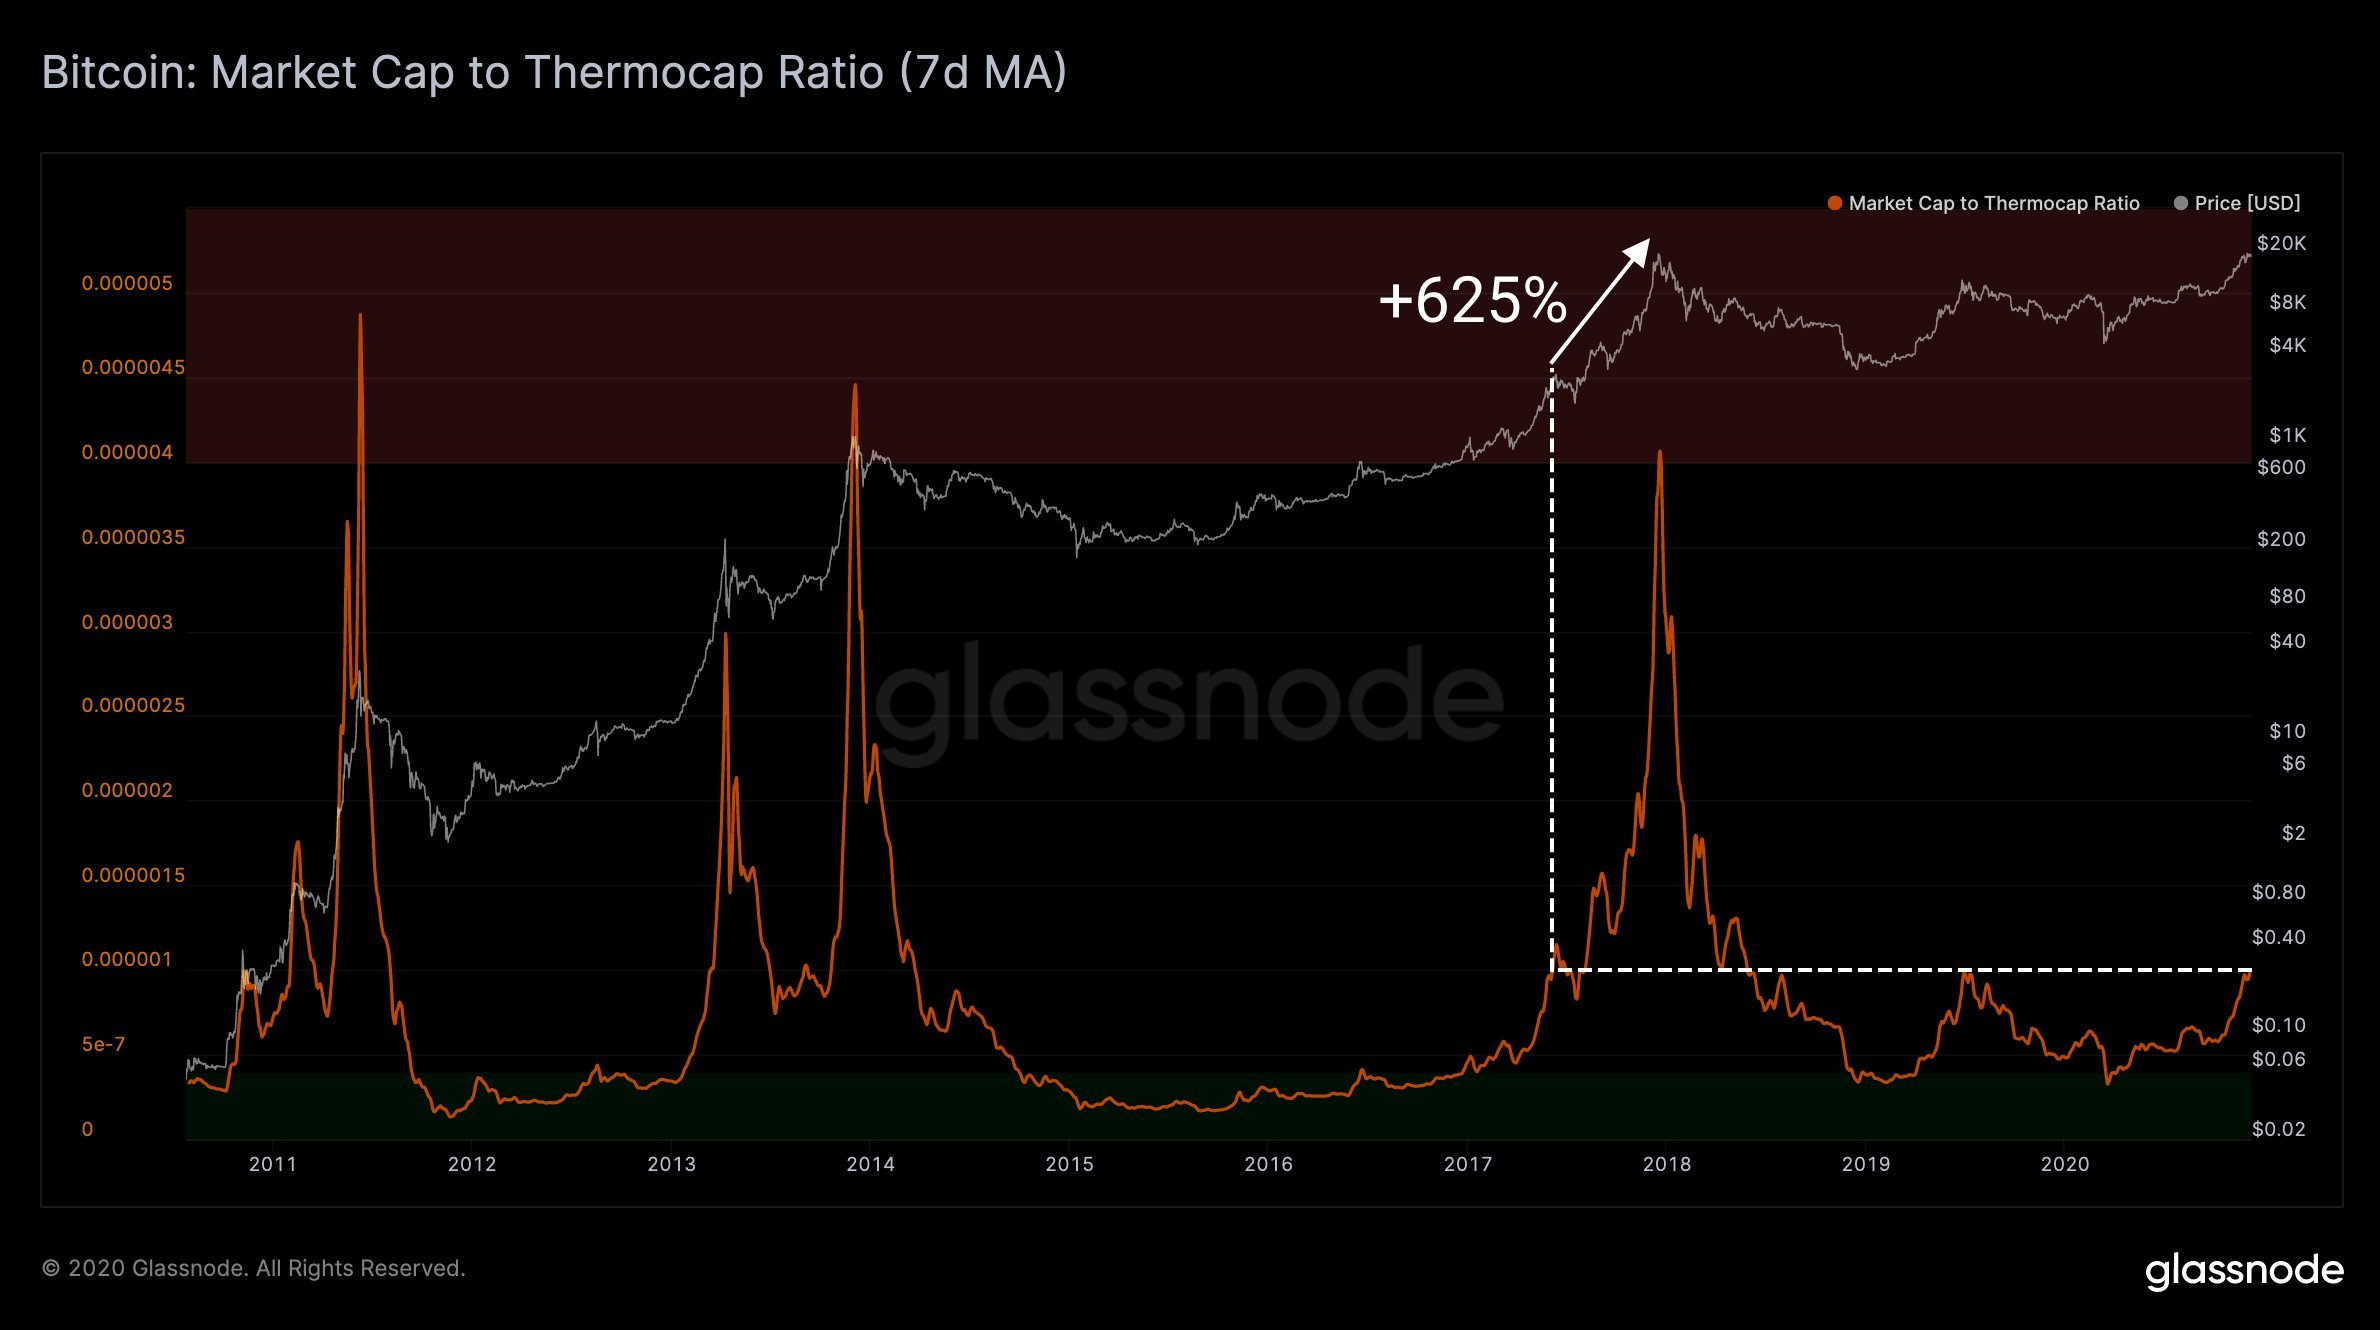
Market Cap to Thermocap Ratio chart
Currently, the Market Cap to Thermocap Ratio sits at 25% from 2017’s local top. In 2017 BTC/USD surged by 625% to the known ATH. Consequently, a comparable swing in the current bull run could see Bitcoin hit levels around $138,000, confirming that the rally is still at an early stage.
Bitcoin Long Term Holder SOPR points to gigantic rally to $328,000
The Long Term Holder SOPR (LTH-SOPR) mainly considers spent outputs with a lifespan of 155 days and more. It is used as a precise indicator for gauging the behavior of HODLers. For now, its prevailing value is just 13% from the top in 2017.
The previous bullish cycle saw Bitcoin breakout by 1,620% to ATH. If the same upswing occurs, Bitcoin is likely to enter into a parabolic rally to $328,000.
-637430932856333679.jpg)
Bitcoin Long Term Holder SOPR (LTH-SOPR)
At the time of writing, the flagship cryptocurrency is trading at $18,200. Therefore, it essential that Bitcoin closes the day above $18,000 to avert potential losses that are likely to extend to the 200 SMA, currently at $17,550.
%20(84)-637430932923213565.png)
BTC/USD 4-hour chart
The freefall from $19,500 does not seem like something to worry about based on the above on-chain metrics. Besides, bull cycles are usually characterized by retracements that allow new investors to come in and create more volume, pushing the asset to higher price levels.
