- The US inflation data could be decisive today, could bring sharp movements.
- The bias remains bearish as long as it stays under the downtrend line.
- Activating the Falling Wedge pattern could announce a new leg higher.
Our GBP/USD forecast sees the pair slip lower today reaching the 1.3187 level also because the United Kingdom economic data reported worse than expected data.
Still, technically, the currency pair showed some oversold signs, but we still need strong confirmation before taking action. The price action has developed a potential reversal pattern, but this formation is far from being confirmed.
3 Free Forex Every Week – Full Technical Analysis
Fundamentally, the US inflation data could be decisive today. The Consumer Price Index is expected to report a 0.7% growth in November versus 0.9% in October, while the Core CPI is expected to register a 0.5% growth compared to 0.6% in October.
In addition, the Prelim UoM Consumer Sentiment could be reported at 67.9 points above 67.4 in the previous reporting period which could be good for the USD.
If you are interested in automated forex trading on the information and data in our forecasts, then check out our guide.
On the other hand, the British Pound was punished by poor UK economic data today. The GDP registered only a 0.1% growth in October versus a 0.4% growth expected, the Construction Output dropped by 1.8% compared to 0.2% growth expected, while the Index of Services registered only a 1.1% growth below 1.2% expected by specialists.
Also, the Industrial Production and the Manufacturing Production came in worse than expected as well.
GBP/USD Forecast: Price Technical Analysis – Falling Wedge
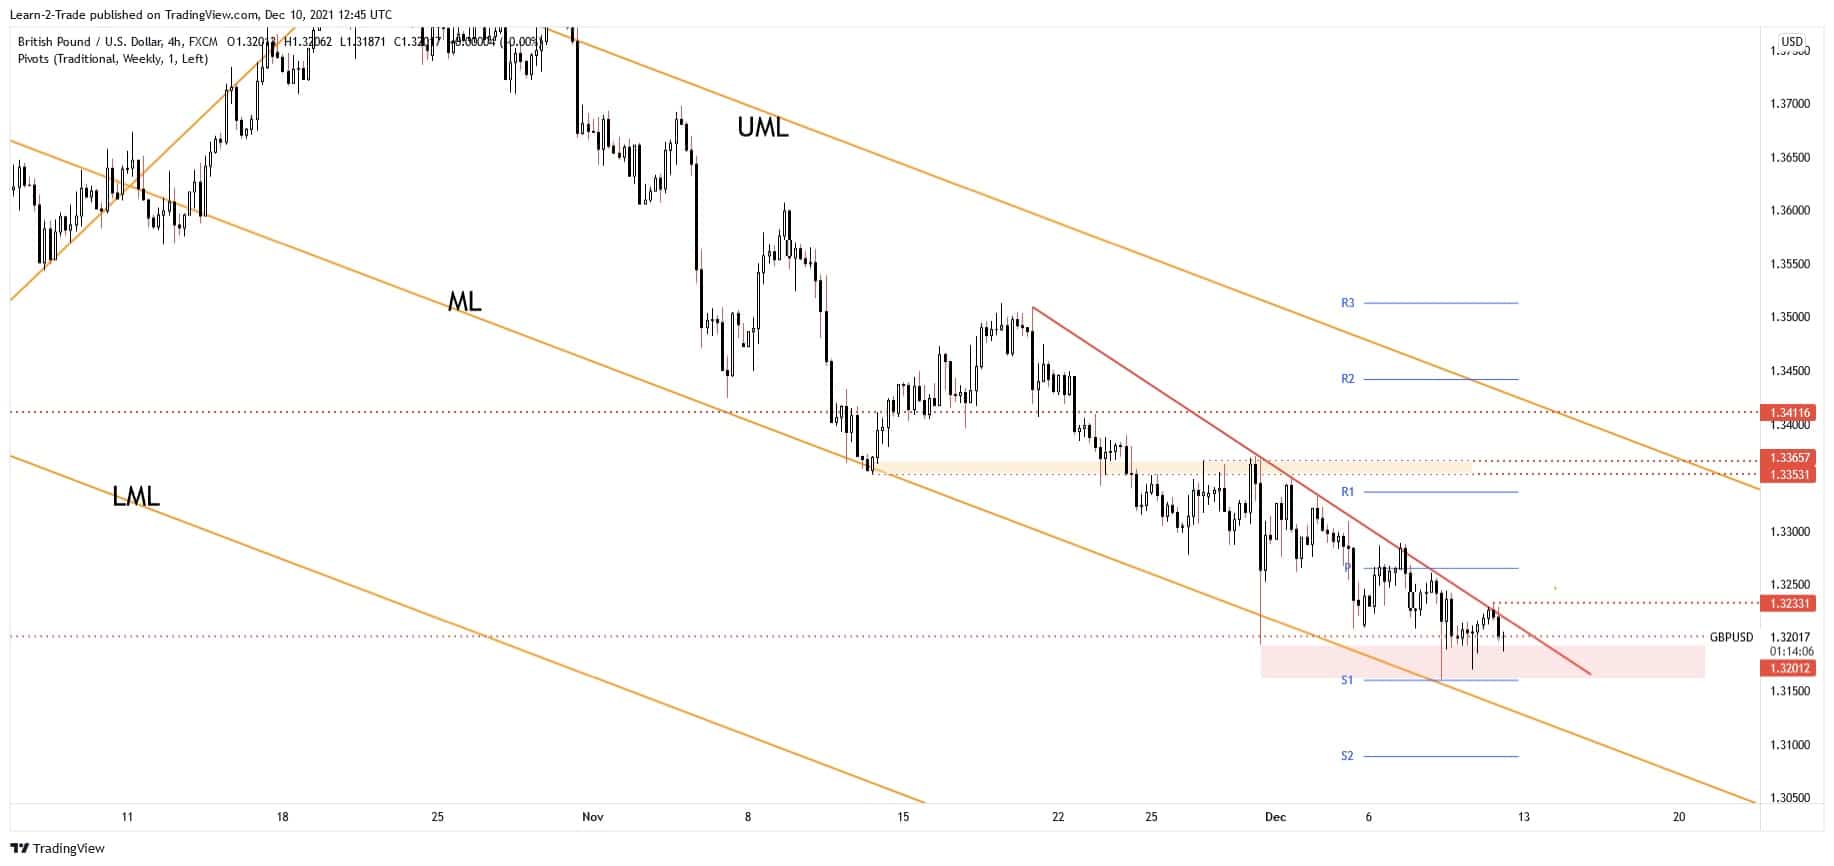
The GBP/USD pair failed to take out the downtrend line and now it has pressured the 1.32 psychological level again. The pressure remains high as long as it stays under the downtrend line. Still, we have a strong demand zone above the weekly S1 (1.3160) level. The pair was rejected by this zone lately.
A valid breakout above the downtrend line may announce a new leg higher. As you can see on the H4 chart, the GBP/USD pair printed a Falling Wedge between the downtrend line and the descending pitchfork’s median line (ML).
Jumping, closing, and stabilizing above the downtrend line followed by a new higher high, a valid breakout above the 1.3233 could activate a strong swing higher.
Looking to trade forex now? Invest at eToro!
68% of retail investor accounts lose money when trading CFDs with this provider. You should consider whether you can afford to take the high risk of losing your money.
