GBP/USD showed considerable volatility throughout the week, but ended the week unchanged. The upcoming week has just one event. Here is an outlook for the highlights and an updated technical analysis for GBP/USD.
British inflation levels moved higher in July. Consumer inflation climbed to 1.0%, up from 0.6% beforehand. The core reading also pointed higher, rising from 1.4% to 1.8%. Both releases beat expectations. Retail sales posted a third straight gain, with a reading of 3.6%. This beat the estimate of 2.0%. The Services PMI showed a strong increase in business activity in July. as the index rose to 60.1, up from 56.5 in June. On the manufacturing front, the Manufacturing PMI improved to 55.3, up from 54.0 beforehand. The 50-level separates contraction from expansion.
GBP/USD daily graph with resistance and support lines on it. Click to enlarge: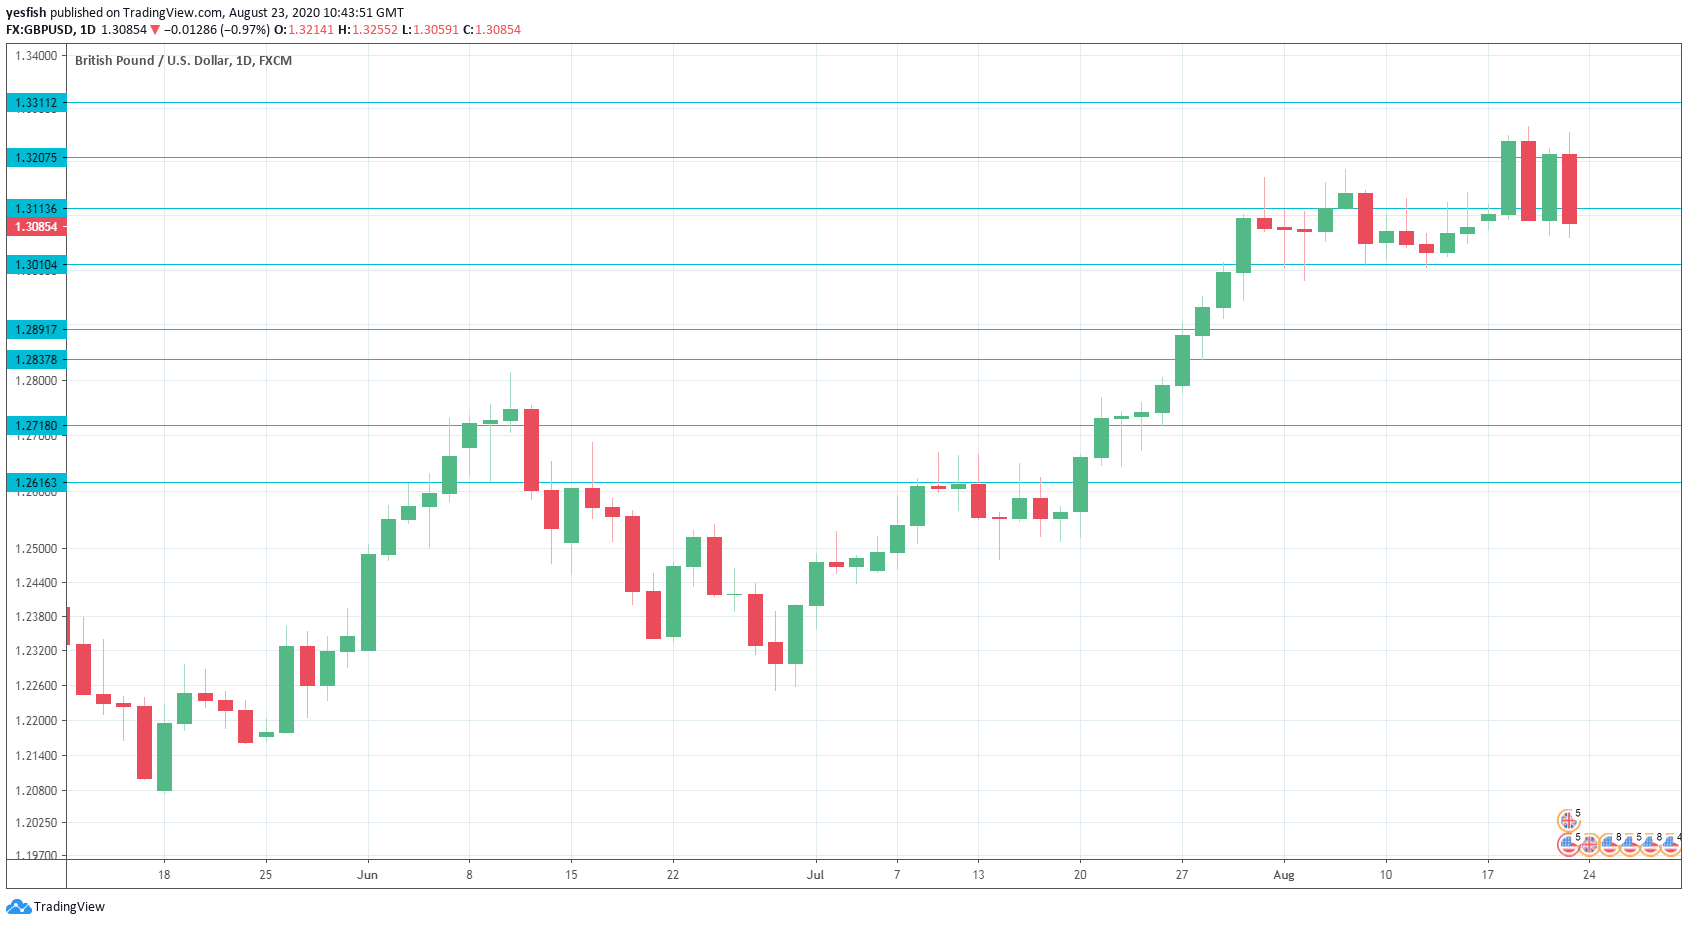
- CBI Realized Sales: Tuesday, 10:00. The Confederation of British Industry’s gauge of sales climbed sharply in July to 4 points, up from -37 beforehand. This was the first positive reading, which indicates a higher sales volume, since February. The uptrend is expected to continue, with an estimate of 8.
Technical lines from top to bottom:
1.3513 is the 52-week high for the pair.
1.3312 has held in resistance since December 2019.
1.3207 is next.
1.3113 is a weak resistance line.
1.3009 is the first support line.
1.2891 is next.
This line is followed by 1.2838.
1.2718 (mentioned last week) has provided support since late July. It is the final support line for now.
.
I remain neutral on GBP/USD
The pound has been showing volatility, but without a clear direction. With no major British events this week, it could be another quiet week for GBP/USD.
Further reading:
- EUR/USD forecast – for everything related to the euro.
- USD/JPY forecast – projections for dollar/yen
- AUD/USD forecast – predictions for the Aussie dollar.
- USD/CAD forecast – Canadian dollar analysis
- Forex weekly forecast – Outlook for the major events of the week.
Safe trading!
