GBP/USD was almost unchanged for a second straight week. The upcoming week has six events, including inflation and retail sales. Here is an outlook for the highlights and an updated technical analysis for GBP/USD.
UK unemployment claims were much worse than expected, with a reading of 94.4 thousand. The estimate was 9.7 thousand. Wage growth fell 1.2% in June, marking a second straight decline. GDP reports were mixed. The monthly report showed a gain of 8.7% in June, above the estimate of 8.1%. However, the initial reading for Q2 GDP declined by a staggering 20.4%, reflecting the severe economic impact of Covid-19. As well, Manufacturing Production climbed 11.0%, up from 8.4% beforehand.
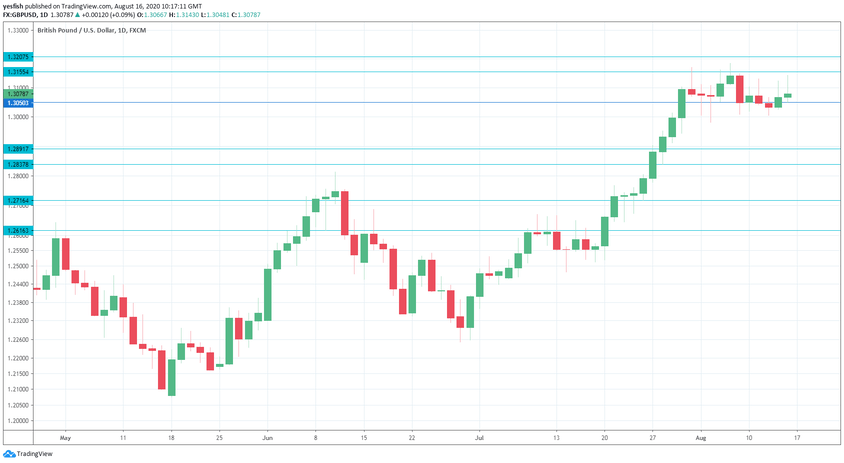
GBP/USD daily graph with resistance and support lines on it. Click to enlarge:
- Inflation Report: Wednesday, 6:00. The headline reading ticked up to 0.6% in June, up from 0.5% beforehand. The estimate for July stands at 0.5%. Core consumer inflation improved from 1.2% to 1.4% in July, but is projected to slow to 1.3%.
- CBI Industrial Order Expectations: Thursday, 10:00. Manufacturers continue to expect decreasing volume, but the rate of decline has been easing. In July, the indicator improved from -58 to -46, and the forecast for August stands at -34.
- GfK Consumer Confidence: Thursday, 23:01. The British consumer remains pessimistic about economic conditions. The indicator has come in at -27 for the past two months and the estimate for August stands at -25.
- Retail Sales: Friday, 6:00. Retail sales have posted double-digit gains for the past two months, but analysts are expecting a small gain of 2.0%.
- Manufacturing PMI: Friday, 8:30. The manufacturing sector is showing slight expansion. The PMI posted a reading of 53.3 in July and the forecast for the initial August read stands at 54.0. The 50-level separates expansion from contraction.
- Services PMI: Friday, 8:30. The index punched into expansion territory in July, climbing from 47.0 to 56.5. The forecast for the initial reading for August is 57.0.
Technical lines from top to bottom:
1.3513 is the 52-week high for the pair.
1.3312 has held in resistance since December 2019.
1.3207 is next.
1.3154 has some breathing room in resistance.
1.3049 is an immediate support line.
1.2891 is next.
This line is followed by 1.2838.
1.2718 (mentioned last week) has provided support since July 24.
1.2616 is the final line for now.
I am neutral on GBP/USD
The pound managed to dodge a bullet, with Q2 GDP falling by over 20%. With both the UK and the US grappling with severe economic conditions due to Covid-19, the pair could remain calm next week.
Further reading:
- EUR/USD forecast – for everything related to the euro.
- USD/JPY forecast – projections for dollar/yen
- AUD/USD forecast – predictions for the Aussie dollar.
- USD/CAD forecast – Canadian dollar analysis
- Forex weekly forecast – Outlook for the major events of the week.
Safe trading!
