GBP/USD reversed directions last week, losing 120 points. The pair closed at 1.2469. This week’s key event is Manufacturing Production. Here is an outlook for the highlights of this week and an updated technical analysis for GBP/USD.
It’s been a rocky start for Donald Trump’s Presidency, who has picked fights with Mexico and Australia but hasn’t outlined economic or fiscal policies. US job numbers were mixed, as Nonfarm Payrolls was better than expected but wage growth was weaker than expected. In the UK, PMIs continued to show expansion. The BoE held rates, but Mark Carney was dovish, saying that future interest rates could move in either direction.
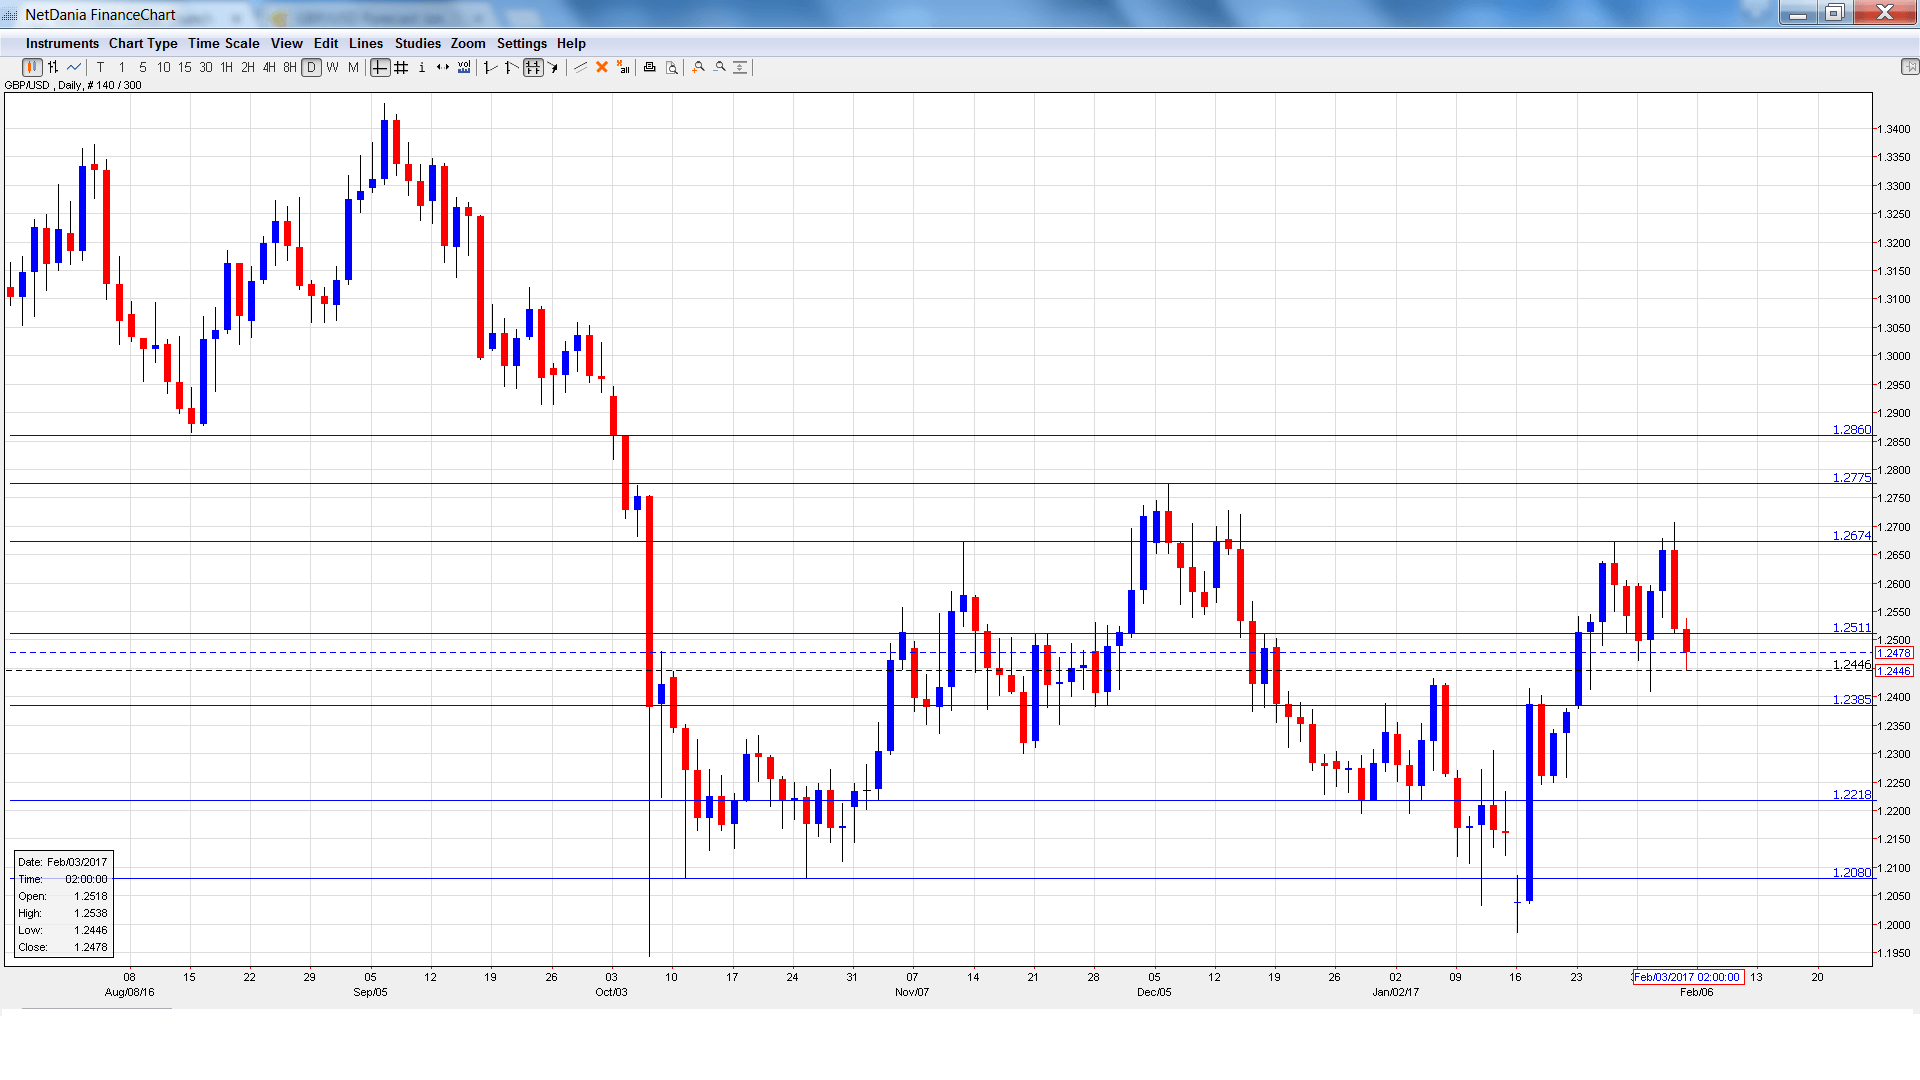
[do action=”autoupdate” tag=”GBPUSDUpdate”/]GBP/USD graph with support and resistance lines on it. Click to enlarge:
- BRC Retail Sales Monitor: Tuesday, 00:01. This index looks at retail sales volumes in BRC shops. In December, the indicator improved to 1.0%, up from 0.6% a month earlier.
- Halifax HPI: Tuesday, 8:30. This indicator provides a snapshot of the strength of the housing sector. In December, the indicator jumped 1.7%, marking its strongest gain in 9 months. The estimate is expected to post a weak gain of 0.2% in January.
- RICS House Price Balance: Thursday, 00:01. The indicator dropped in December to 24%, short of the estimate of 32%. Little change is expected in the January release.
- 30-year Bond Auction: Thursday, Tentative. The 10-year bond rose to 1.96% in December, marking a 3-month high. This was up from the November yield of 1.49%.
- Manufacturing Production: Friday, 9:30. This is the key event of the week and should be treated as a market-mover. The indicator rebounded in November, posting a strong gain of 1.3%. This was well above the estimate of 0.6%. The estimate for December stands at 0.3%.
- Goods Trade Balance: Friday, 9:30. The UK’s trade deficit widened to GBP 12.2 billion in November, higher than the forecast of a deficit of GBP 11.2 billion. The deficit is expected to narrow to GBP 11.5 billion in the December report.
- NIESR GDP Estimate: Friday, 15:00. This monthly report helps analysts predict official GDP releases, which are published every quarter. In December, the indicator edged up to 0.5%, marking a 6-month high. Will the upward trend continue in January?
* All times are GMT
GBP/USD Technical Analysis
GBP/USD opened the week at 1.2594 and dropped to a low of 1.2409. The pair then reversed directions and climbed to a high of 1.2706, testing resistance held at 1.2674 (discussed last week). GBP/USD retracted late in the week and closed at 1.2469.
Live chart of GBP/USD:
Technical lines from top to bottom
We begin with resistance at 1.2860.
1.2775 was a high point in December 2016.
1.2674 was a cap in November.
1.2511 is an immediate resistance line.
1.2385 is providing support.
1.2218 is next.
1.2080 is protecting the symbolic 1.20 level. It is the final support line for now.
I am bearish on GBP/USD.
Monetary divergence favors the dollar, as the Fed will likely raise rates in the first half of 2017. The BoE appears content with low rates, and will be hesitant to make any moves as Britain prepares to start Brexit negotiations with Europe.
Our latest podcast is titled Trumping Trade and the Donald Dollar
Follow us on Sticher or iTunes
Safe trading!
Further reading:
- For a broad view of all the week’s major events worldwide, read the USD outlook.
- For EUR/USD, check out the Euro to Dollar forecast.
- For the Japanese yen, read the USD/JPY forecast.
- For the kiwi, see the NZD/USD forecast.
- For the Australian dollar (Aussie), check out the AUD to USD forecast.
- For the Canadian dollar (loonie), check out the USD to CAD forecast.
