GBP/USD reversed directions last week and lost 160 points. The pair closed at 1.3061. This week’s key event is Manufacturing Production. Here is an outlook on the major market-movers and an updated technical analysis for GBP/USD.
The pound posted sharp losses after the BoE lowered rates by a quarter point to 0.25%, an all-time low. There was excellent news from the US labor markets, as Nonfarm Payrolls gained 255K jobs and wage growth also improved.
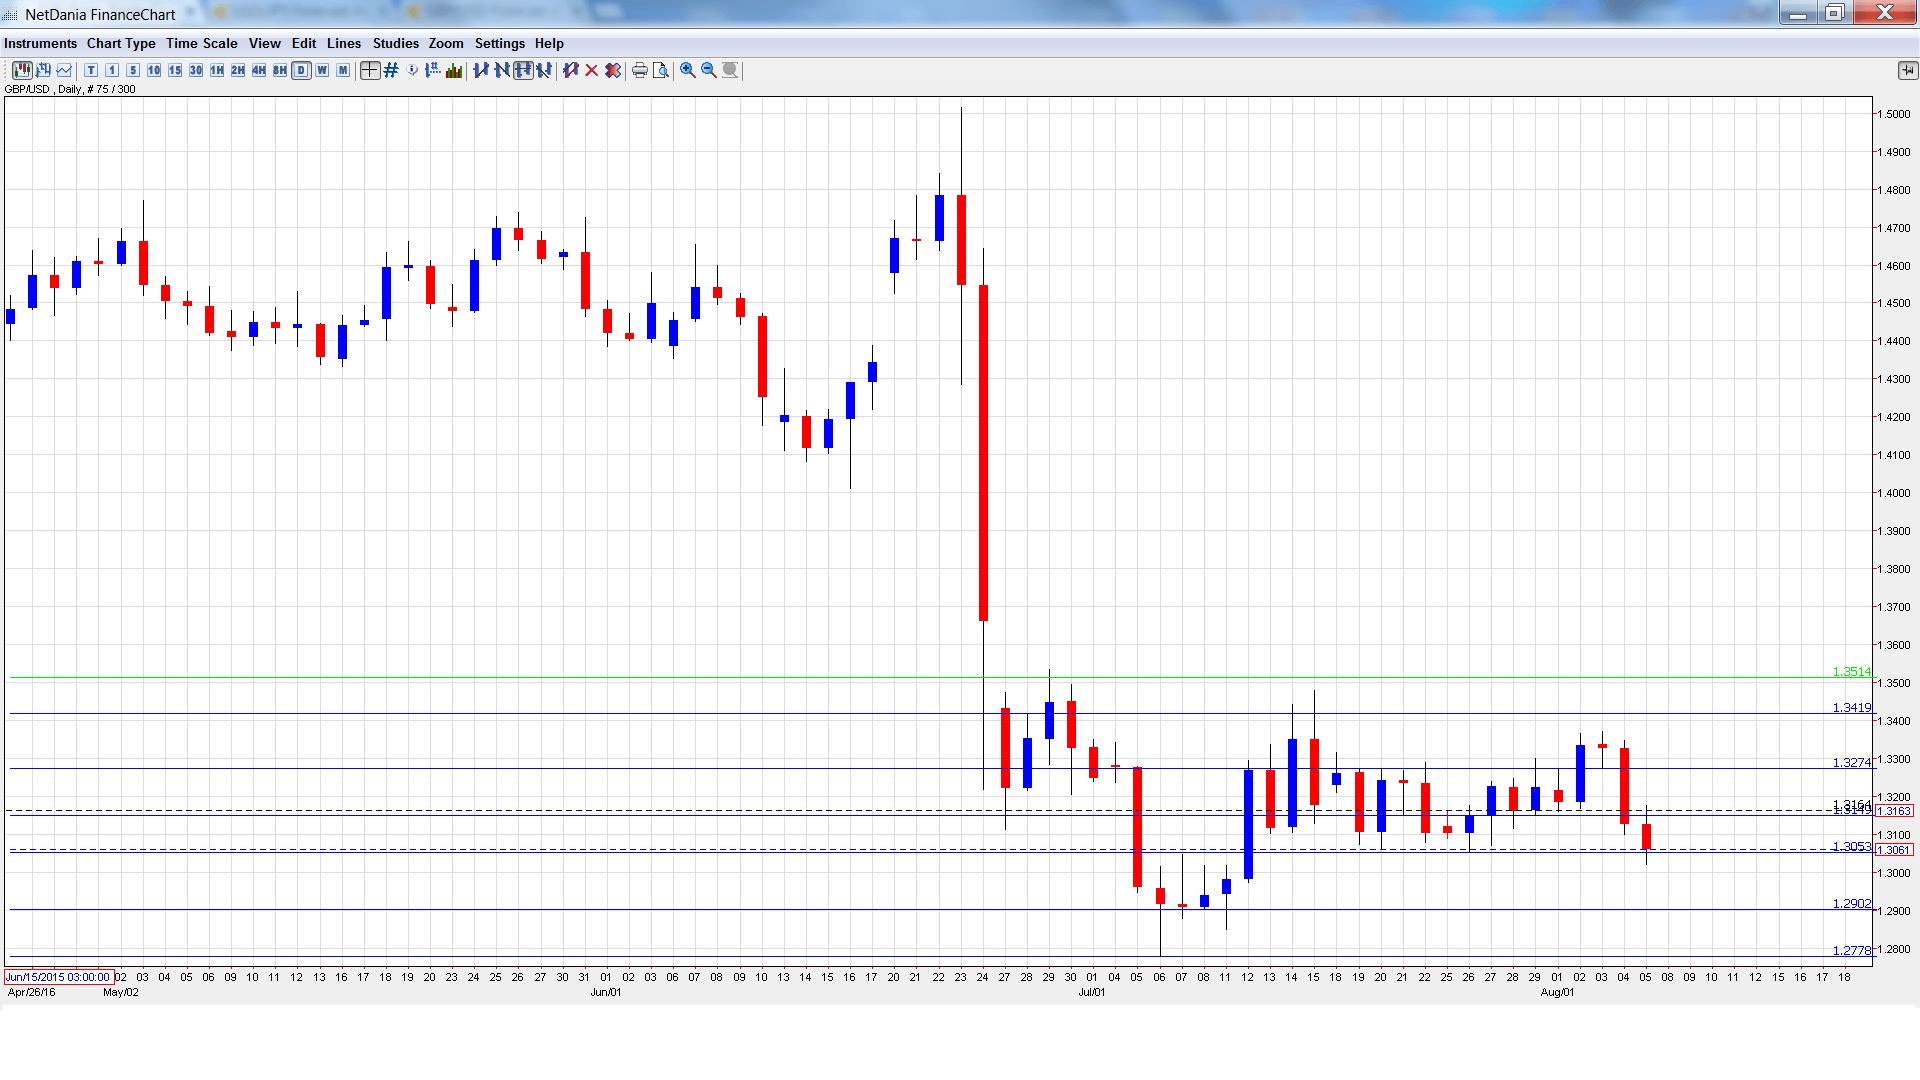
[do action=”autoupdate” tag=”GBPUSDUpdate”/]GBP/USD graph with support and resistance lines on it. Click to enlarge:
- BRC Retail Sales Monitor: Monday, 23:01. The indicator reversed directions in June and dipped 0.5%, its third decline in four months. This points to weak consumer spending in the UK.
- Manufacturing Production: Tuesday, 8:30. This is the key event of the week. The indicator declined 0.5% in May, but this beat the forecast of -1.2%. The estimate for the June release stands at a flat 0.0%.
- Goods Trade Balance: Tuesday, 8:30. The trade balance deficit narrowed in May to GBP 9.9 billion, its lowest level in five months. The positive trend is expected to continue, with the June estimate standing at GBP 9.6 billion.
- NIESR GDP Estimate: Tuesday, 14:00. This monthly indicator helps analysts predict the official GDP report, which is released on a quarterly basis. The indicator improved to 0.6% in June, its highest gain this year.
- RICS House Price Balance: Wednesday, 23:01. This indicator provides a snapshot of the level of activity in the housing sector. In June, the indicator gained 16%, well above the forecast of 8%. The forecast in July stands at 19%.
- Construction Output: Friday, 8:30. The indicator has been struggling, with four declines in the past five months. The markets are expecting a turnaround in June, with the estimate standing at 0.9%.
- CB Leading Index: Friday, 13:30. This minor event posted a decline of 0.2% in May, marking its first decline in 7 months. Will the indicator improve in the June report?
* All times are GMT
GBP/USD Technical Analysis
GBP/USD opened the week at 1.3216 and posted a high of 1.3372. The pair then reversed directions and dropped all the way to 1.3020, breaking support at 1.3064 (discussed last week). GBP/USD closed the week at 1.3061.
Live chart of GBP/USD: [do action=”tradingviews” pair=”GBPUSD” interval=”60″/]
Technical lines from top to bottom
We begin at 1.3514, which has held firm since late June.
1.3419 is next.
1.3276 was tested in resistance as the pair pushed above the 1.33 line.
1.3149 has switched to resistance following strong losses by GBP/USD.
1.3053 is protecting the symbolic 1.30 level. It is a weak support line.
1.2902 is providing strong support.
1.2778 is the pair’s lowest level since 1985. This is the final support level for now.
I am bearish on GBP/USD.
The British economy has taken a hit from Brexit and the markets are bracing for more weak economic data out of the UK. Over in the US, the chances of a rate hike before the end of the year have increased due to the strong payrolls report.
Our latest podcast is titled Carney King of Governors, Small in Japan
Follow us on Sticher or on iTunes
Further reading:
- For a broad view of all the week’s major events worldwide, read the USD outlook.
- For EUR/USD, check out the Euro to Dollar forecast.
- For the Japanese yen, read the USD/JPY forecast.
- For the kiwi, see the NZD/USD forecast.
- For the Australian dollar (Aussie), check out the AUD to USD forecast.
- For the Canadian dollar (loonie), check out the USD to CAD forecast.
