GBP/USD lost ground for a second straight week, losing 100 points. The pair closed at 1.2485. This week’s key event is Current Account. Here is an outlook for the highlights of this week and an updated technical analysis for GBP/USD.
The US dollar continued to post broad gains, buoyed by the Federal Reserve’s quarter point rate hike to 0.50%. This was just the second rate hike since the financial crisis in 2008. The Fed was hawkish in its rate statement and upgraded its hike forecast for 2017. This triggered a US dollar rally and the pound continued to lose ground. Elsewhere, US retail sales missed expectations, while US CPI came in at 0.2%, matching the forecast. In the UK, CPI improved to 1.2%, edging above the estimate of 0.1%. Employment numbers were solid, as wage growth and jobless claims both beat their estimates.
Updates:
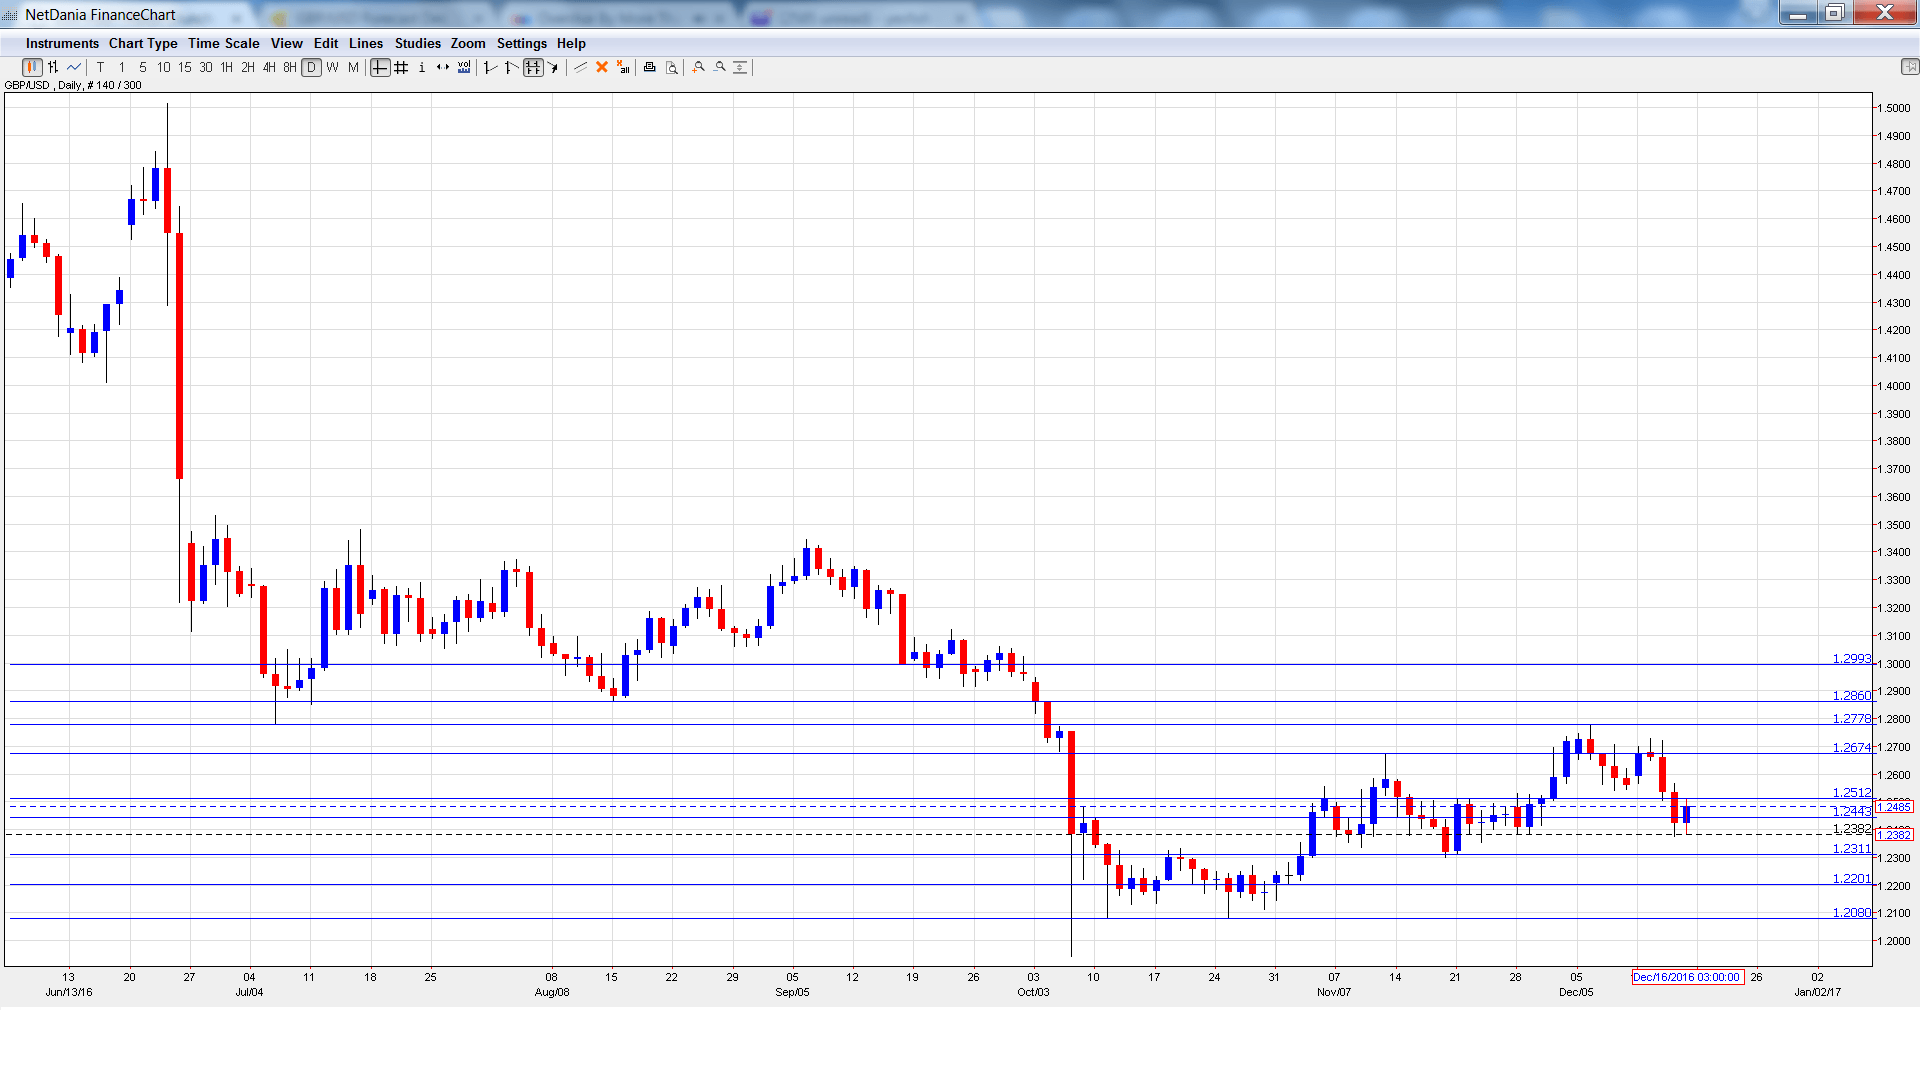
GBP/USD graph with support and resistance lines on it. Click to enlarge:
- CBI Realized Sales: Tuesday, 11:00. Retailers and Wholesalers are reporting higher sales volumes, as the indicator jumped to 26 points in November. The forecast for the December report stands at 21 points.
- Public Sector Net Borrowing: Wednesday, 9:30. In November, the budget deficit dropped sharply to GBP 4.3 billion. This beat the estimate of GBP 5.9 billion. However, the deficit is expected to balloon in December, with an estimate of GBP 11.5 billion.
- GfK Consumer Confidence: Thursday, 00:01. The indicator continues to post declines and dipped to -8 points in November, weaker than the forecast of -4 points. The estimate for December stands at -8 points.
- Current Account: Friday, 9:30. Britain’s deficit narrowed to GBP -28.7 billion in Q2, smaller than the forecast of GBP -30.5 billion. The forecast for Q3 is GBP -28.3 billion.
- Final GDP: Tuesday, 9:30. Second Estimate GDP for Q2 posted a gain of 0.5%, matching the forecast. Final GDP, the last of three GDP reports, is also forecast to come in at 0.5%.
* All times are GMT
GBP/USD Technical Analysis
GBP/USD opened the week at 1.2591 and climbed to a high of 1.2728, as resistance held at 1.2778 (discussed last week). The pair then reversed directions and dropped to a low of 1.2374. GBP/USD partially recovered and closed the week at 1.2485.
Live chart of GBP/USD:
Technical lines from top to bottom
We begin with resistance at 1.2993.
1.2860 has provided resistance since early October.
1.2778 held firm for a second straight week, as the pound posted gains before retracting.
1.2674 was a cap in November.
1.2512 has switched to a resistance role. It is a weak line.
1.2448 is next.
1.2311 has been a cushion since late November.
1.2201 follows in support.
1.2080 is the final support line for now.
I am bearish on GBP/USD.
The US dollar is flying high and could make further headway in the aftermath of the Fed rate hike. Economic sentiment remains high ahead of Donald Trump taking over in Washington, which could be bullish for the greenback.
Our latest podcast is titled The FED and the Road Ahead
Follow us on Sticher or iTunes
Further reading:
- For a broad view of all the week’s major events worldwide, read the USD outlook.
- For EUR/USD, check out the Euro to Dollar forecast.
- For the Japanese yen, read the USD/JPY forecast.
- For the kiwi, see the NZD/USD forecast.
- For the Australian dollar (Aussie), check out the AUD to USD forecast.
- For the Canadian dollar (loonie), check out the USD to CAD forecast.
